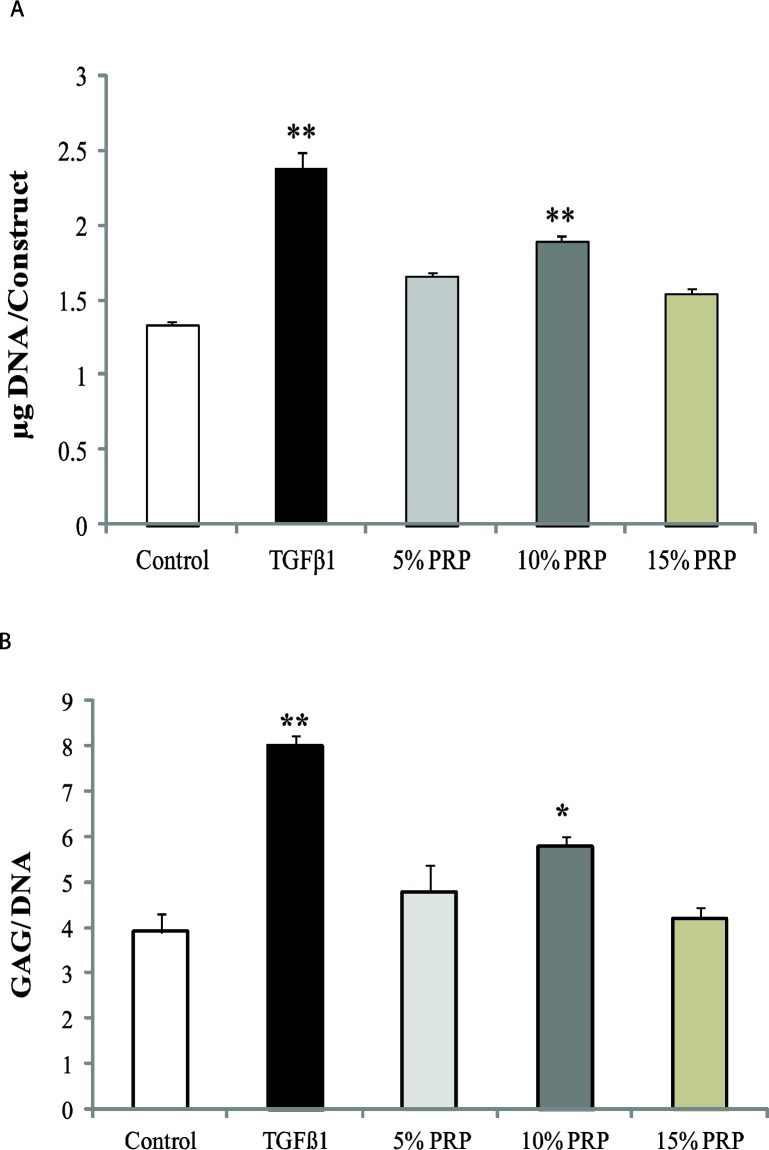
Figure 2.
Biochemical analysis of each construct. A) Total DNA (µg) per construct in different groups. B) Glycosaminoglycan (GAG) content per DNA in different groups. Asterisk indicates that the medium condition is significantly different from control by ANOVA (*(P<0.05), ** (P<0.001)). Error bars represent standard error of the mean

