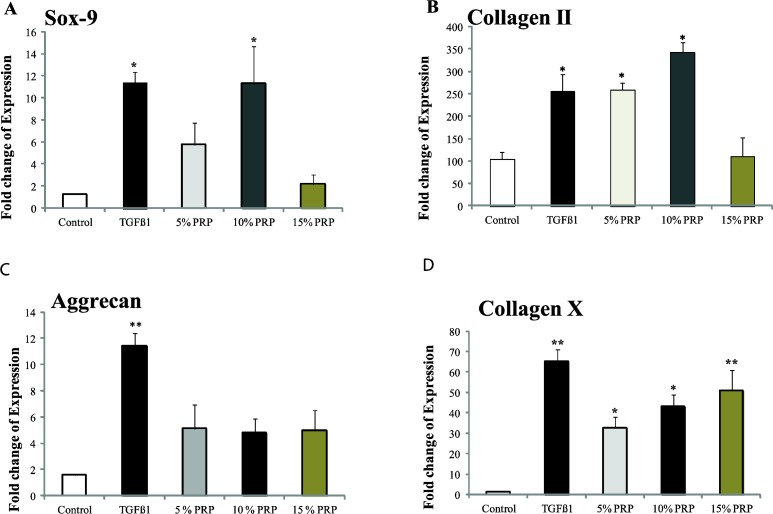
Figure 4.
Day 14 reverse transcriptase-polymerase chain reaction for different groups. Data presented as fold changes from day 0 monolayer cells A) Sox-9, B) Collagen type II, C) Aggrecan and D) Collagen type X. Error bars represent standard error of the mean. Asterisk indicates that the medium condition is significantly different from control by ANOVA (*(P<0.05), ** (P<0.001))

