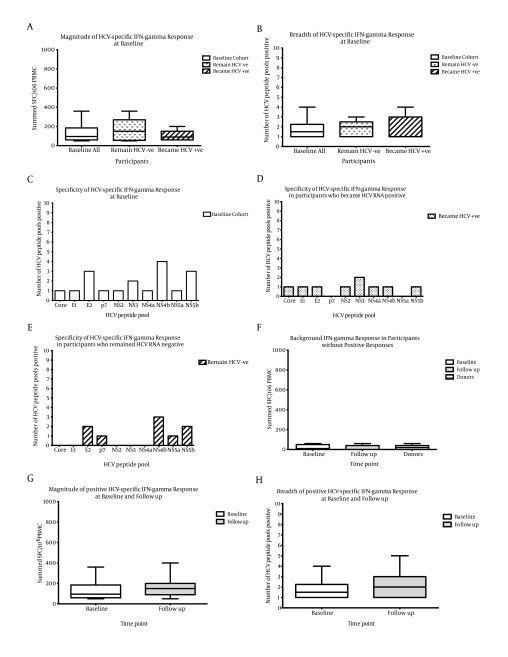
Figure 2. HCV-Specific IFN-Gamma Responses From HCV Uninfected Participants.
There was a similar A) magnitude (Mann-Whitney, P = 0.751) and B) breadth (Mann-Whitney P = 0.734) of IFN-γ responses at baseline between those who remained HCV RNA negative (dotted bars, n = 5) and those who became HCV RNA positive (hatched bars, n = 5). C) The specificity of responses were mainly directed to E2, NS4b and NS5b at baseline, with a trend for a broader specificity in D) those who became HCV RNA positive, detecting 8 different pools compared to E) those who remained HCV RNA negative. F) Background negative responses at baseline (n = 43) and follow up (n = 34) were of a similar magnitude to background responses seen in low risk control participants (termed donors, n = 15). G) The magnitude and H) breadth of positive HCV-specific IFN-gamma responses from uninfected participants at follow up were similar to baseline (n = 10 white bars, follow up (n = 8 grey bars, Mann-Whitney P > 0.200). Box and whisker plots represent the minimum to maximum values.

