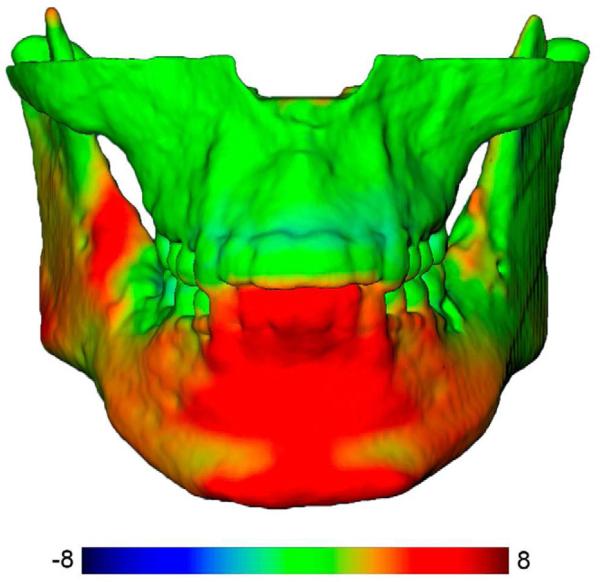
Figure 3.
Color-coded map of the surface distances between pre surgery and 1 year after mandibular advancement surgery. The virtual surface models were registered at the cranial base. Red represents the anterior displacement of the chin and inferior displacement of the inferior border of the mandible (color-code scale of −8 to +8 mm); green represents anatomic regions that did not present changes with treatment.

