
Figure 3. Tail vein delivery of 5E10 vg/ml of AAV9 Sh BNIP3 reversed cardiac remodeling and improved LV diastolic function and contractility in a rat model of systolic HF.
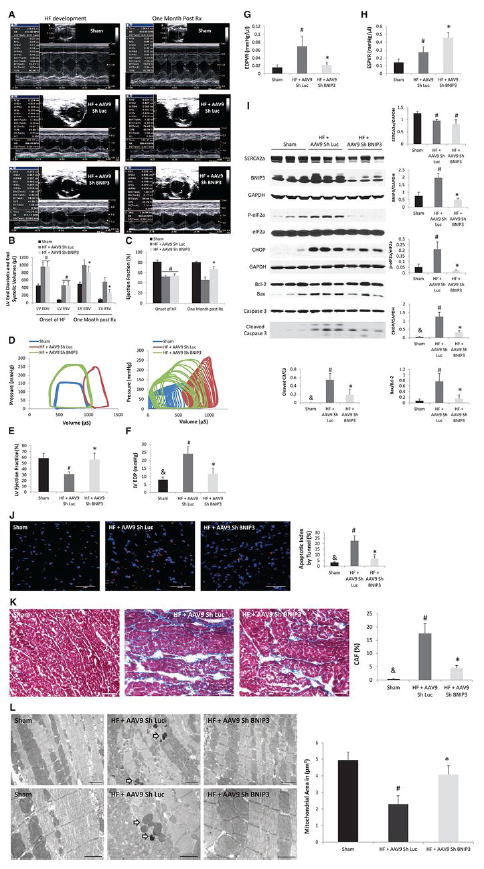
3 A-C: M-mode images of the above group of animals before and one month after treatment with AAV9 Sh Luc vs AAV9 Sh BNIP3. LV volumes were significantly decreased and the LVEF was significantly increased one month after treatment with AAV9 Sh BNIP3, *P<0.05 vs HF + AAV9 Sh Luc, #P<0.05 vs sham. 3-D: P-V loop tracings in the different groups at baseline and during inferior vena cava occlusion. 3-E: LVEF significantly improved one month after Sh BNIP3 treatment, *P<0.05 vs HF + AAV9 Sh Luc and #P<0.05 vs sham. 3 F-G: LVEDP and EDPVR were significantly increased in the Sh Luc group, #P<0.05 vs sham, &P<0.05 vs other two groups. Those parameters were significantly decreased one month after Sh BNIP3 treatment, *P<0.05 vs HF + AAV9 Sh Luc. 3-H: LV contractility significantly increased in the Sh BNIP3 group, *P<0.05 vs HF + AAV9 Sh Luc. Note that the Sh Luc group has a falsely increased ESPVR compared to sham animals as their LVESP are higher, but their V0 is significantly shifted to the right as compared to the sham group. 3-I: Western blot analysis of LV tissue lysate showed robust decrease in BNIP3 expression, ER stress (p-eIF2a) and ER stress apoptotic marker (CHOP) as well as in Bax to Bcl-2 ratio and in cleaved caspase 3 in the Sh BNIP3 group, P<0.05 vs HF + AAV9 Sh Luc, #P<0.05 vs sham and &P<0.05 vs other two groups. There was significant decrease in SERCA2a expression in the HF groups, #P<0.05 vs sham. 3 J-K: There were robust decreases in myocardial apoptosis and in LV interstitial fibrosis in the Sh BNIP3 group, *P<0.05 vs HF + AAV9 Sh Luc, #P<0.05 vs sham and &P<0.05 vs other two groups. 3-L: Ultrastructurally, there was significant mitochondrial fragmentation and cristae destruction with dilated T tubules and damaged myofibrils. BNIP3 knockdown robustly attenuated mitochondrial fragmentation and cristae destruction with the mitochondrial area almost back to control level and attenuated myofibrillar damage, #P<0.05 vs sham and *P<0.05 vs HF + AAV9 Sh Luc. Arrows showing the presence of autophagosomes. Above images are 5,000X magnified, scale bar 2μm. Lower images are 12,000X magnified, scale bar 1μm.