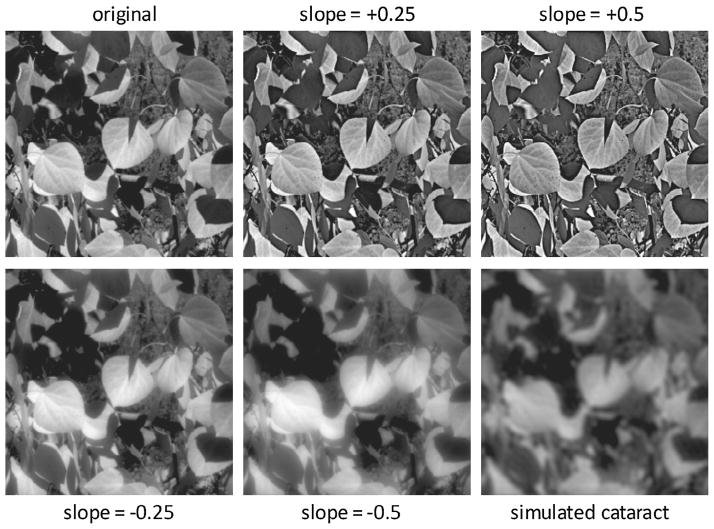
Fig. 1.
An example of the natural images used as adaptation and test stimuli for the experiments. The upper left image shows the original image before filtering (α = 0), while the upper middle and right images illustrate how the image was over-sharpened by biasing the slope of the amplitude spectrum (α = 0.25 or 0.5) to amplify high and attenuate low spatial frequencies. The lower left and middle images show the progressive blurring introduced by filtering to attenuate high spatial frequencies and to amplify low spatial frequencies (α = −0.25 and −0.5). Finally, the bottom-right image shows a simulation of the blur predicted from a typical cortical cataract, based on filtering the original image amplitude spectrum by the average loss in contrast sensitivity estimated for a population of patients (Sakamoto, 2003).

