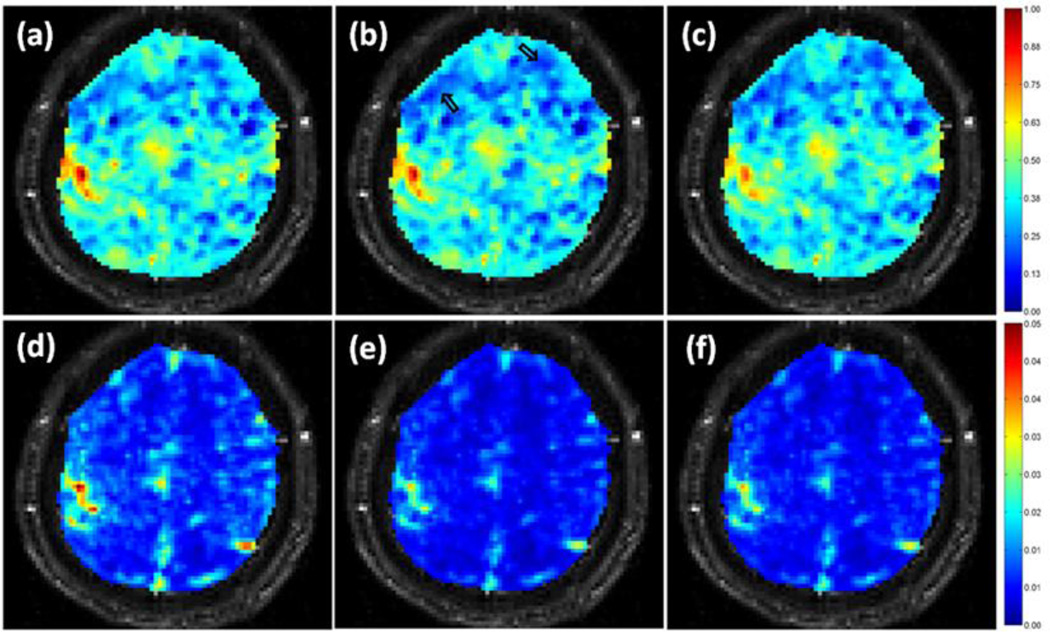
Figure 4.
(a)–(c) Single slice CNR maps of a task-related experiment calculated from (a) the original data, (b) the data denoised by the proposed method, and (c) the data processed using the adaptive filtering method. The two arrows in (b) point to groups of voxels with decreased CNR. (d)–(f) Single slice temporal standard deviation maps obtained from (d) the original data, (e) the data denoised by the proposed method, and (f) the data smoothed using the adaptive filtering method.

