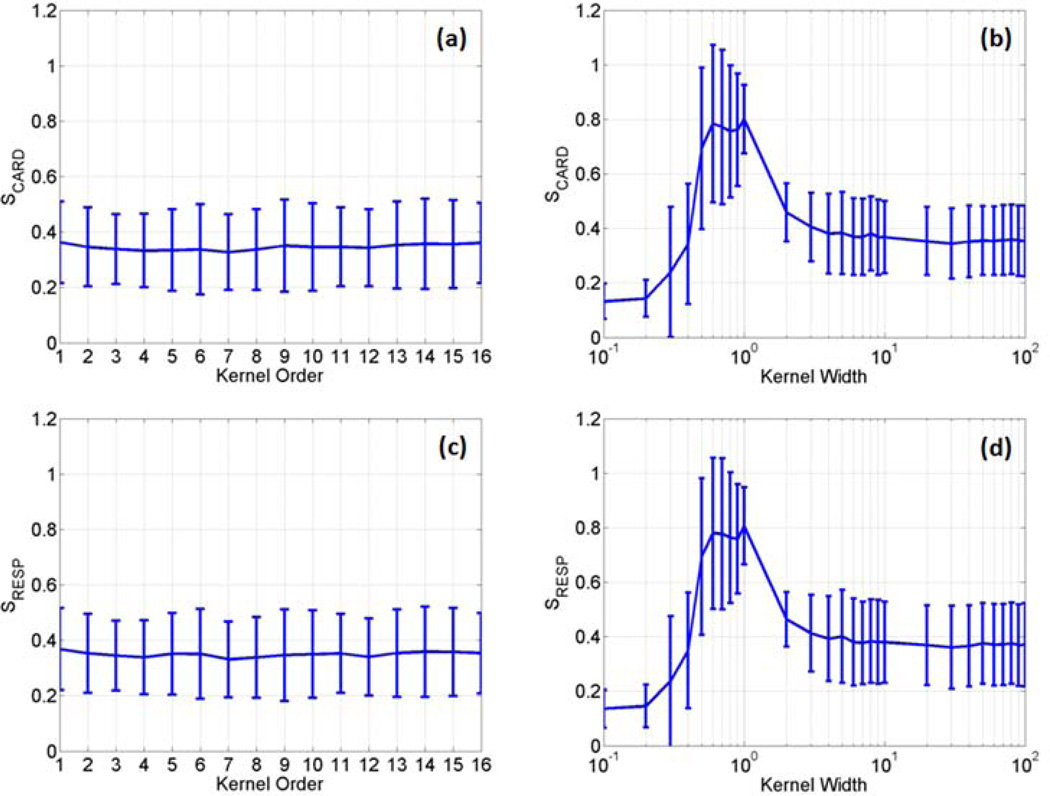
Figure 6.
The average and standard deviation of SCARD and SRESP values calculated as a function of the polynomial kernel order (a, c) and the RBF kernel width (b, d) using two data sets collected from the second task-related fMRI experiment, and three data sets from the third task-related fMRI experiment.

