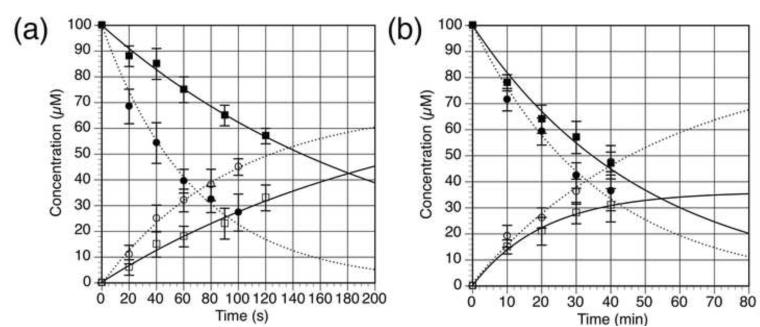
Figure 4.
Time course for photolysis of BHQ-O-5HT (closed circles) and BHQ-N-5HT (closed squares) at (a) 365 nm (1PE) and (b) 740 nm (2 PE) in KMOPS buffer (pH 7.2) and rise of 5-HT from BHQ-O-5HT (open circles) and BHQ-N-5HT (open squares), respectively. The concentration was determined by HPLC using an external standard and is the average of at least 3 runs. Lines are least-squares fits of a single exponential decay or a single exponential rise to max. From the decay curves, Qu and δu were calculated. Error bars represent the standard deviation of the measurement.

