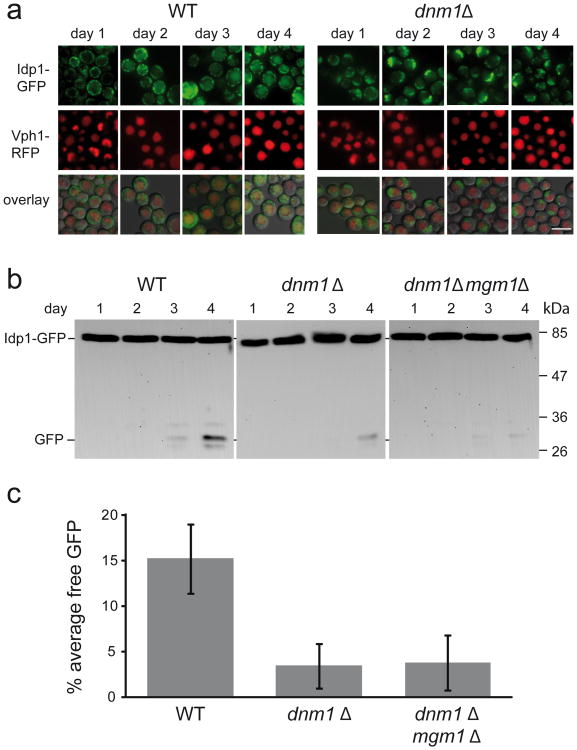
Figure 1. The kinetics of stationary phase mitophagy are determined by mitochondrial dynamics, not size.
a. Wild-type and dnm1Δ cells expressing Vph1-RFP and Idp1-GFP were grown in minimal SD medium and transferred to lactate medium at an initial density of OD600 0.08. The cells were then sampled daily and analyzed by fluorescence microscopy (100x objective) during stationary phase mitophagy in lactate medium. Scale bar= 5μm. b. Wild-type, dnm1Δ and dnm1Δ mgm1Δ mutants were grown in SL medium as described in Materials and Methods, and samples (10 OD600 units) were taken at each time point. Protein extracts were prepared and equal protein amounts (20 μg) were subjected to SDS-PAGE and immunoblotting with anti-GFP antibody. c. Quantification of the percent free GFP at the day 4 time point in each of the three strains analyzed in b, using 4 independent experiments for each strain. Error bars indicate standard deviation. ANOVA, p<0.001; N=4.

