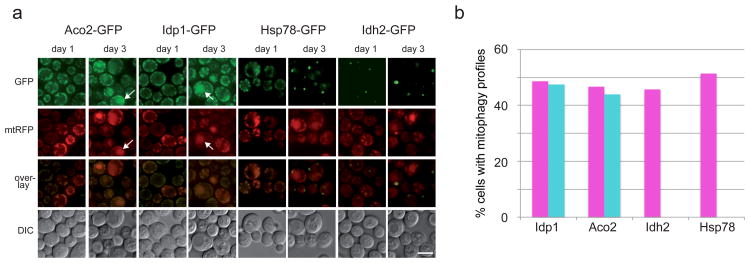
Figure 6. Intra-mitochondrial segregation and differential mitophagic targeting.
a. Cells expressing chromosomally-tagged GFP chimeras of Aco2, Idh2, Idp1 and Hsp78 as wells as a plasmid-borne (pDJB12), mitochondrially targeted RFP (mtRFP) were incubated in SL-leucine medium for 3 days and imaged daily. Aco2 and Idp1 show clear mitophagic targeting (white arrows point at specific examples) by day 3, while Idh2 and Hsp78 show weak or no mitophagy. In addition, Idh2 and Hsp78 show different degrees of segregation relative to the mtRFP marker, while Idp1-GFP and Aco2-GFP show a near-complete co-localization with mtRFP. Scale bar, 5μm. b. Quantification of the frequency of mitophagy from (a); the percentage of cells showing mitophagic profiles in the red (magenta bars; plasmid-borne mtRFP) or green (turquoise bars; integrated C-terminal GFP chimerae) was calculated for each GFP chimera. Idp-GFP, red N=76, green N=82; Aco2-GFP, red N=79, green N=82; Idh2-GFP, red N=72, green N=72; Hsp78-GFP, red N=70, green N=70.

