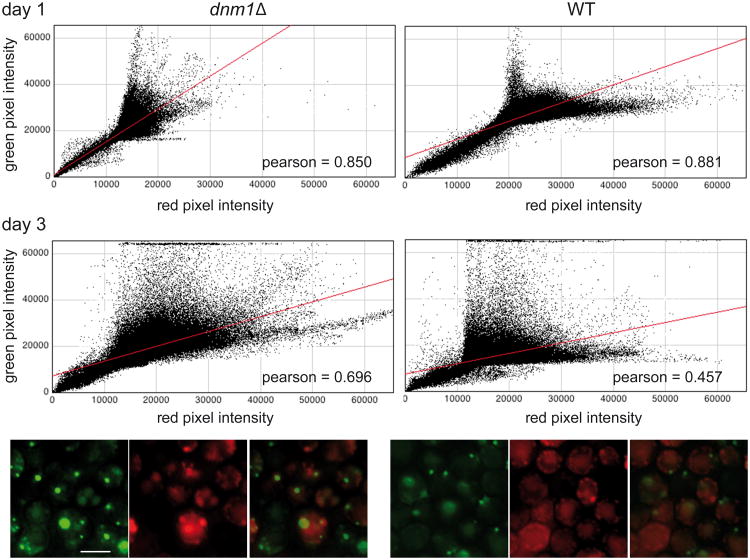
Figure 7. Decreased segregation of Hsp78-GFP in dnm1Δ cells.
Wild-type and dnm1Δ cells expressing integrated Hsp78-GFP and plasmid-borne mtRFP were grown on lactate medium for 3 d. Cells were imaged daily and the images were analyzed using ImageJ as described in “Methods”. Graphs illustrate the distribution of pixels associated with specific values of RFP and GFP channel intensities, respectively. Diagonal concentrations of dots indicate spatial correlation between the signals. The colored photographic panels at the bottom illustrate the increased intensity correlation of the two channels at the 3 day time point in the dnm1Δ mutant, relative to the wild-type cells. Scale bar, 5μm.

