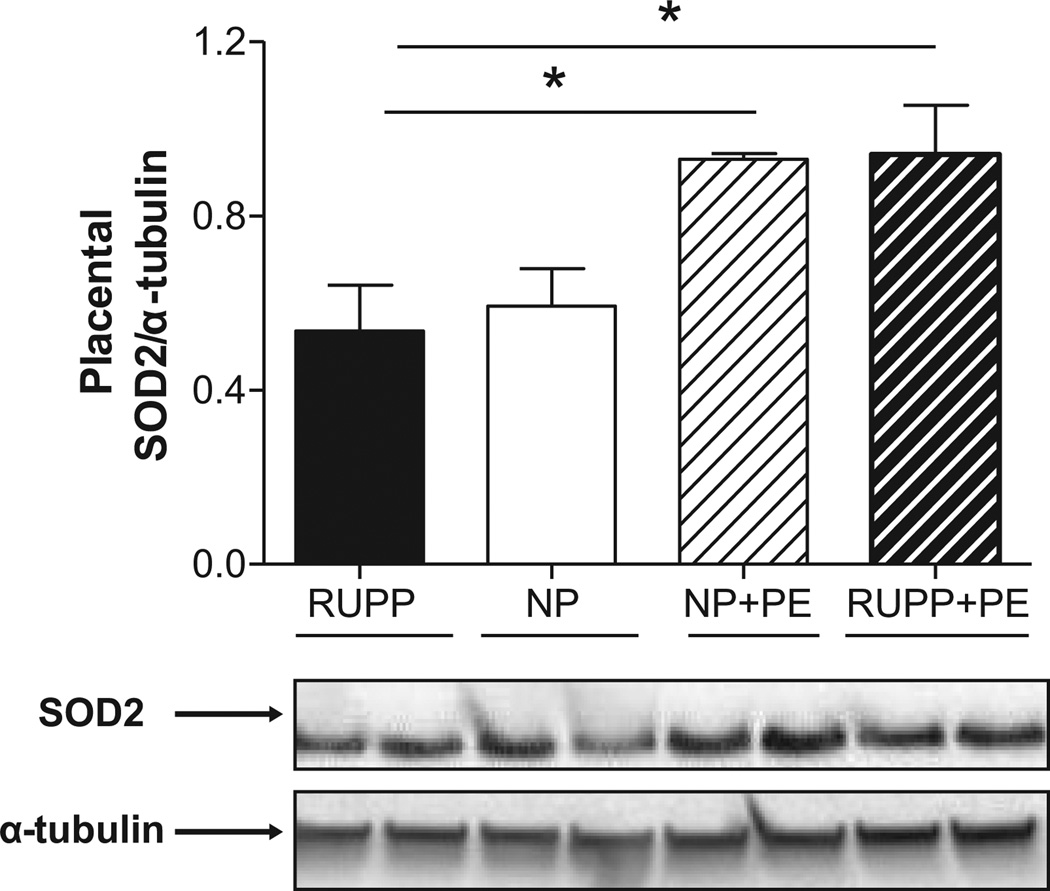
Figure 8. Placental superoxide dismutase 2 (SOD2) expression.
SOD2 was increased (P<0.05) in the RUPP+Ex and NP+Ex groups compared to the RUPP rats. Representative blot images for PHD1 and β-actin are below the graph. Data are expressed as mean ± SEM. Statistical significance for comparisons that are different by post-hoc testing are indicated by lines above the bars and * P<0.05.

