
Fig. 1.
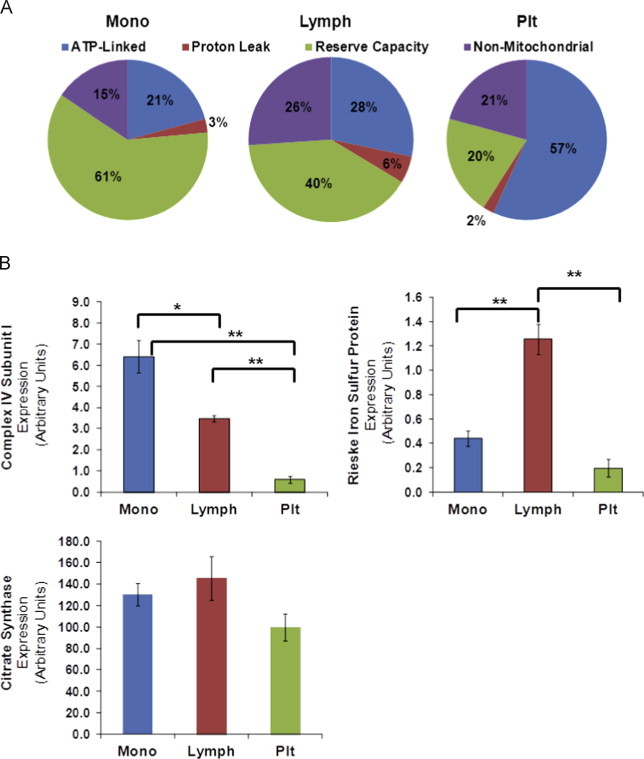
Distinct mitochondrial metabolism in leukocytes and platelets. Monocytes, lymphocytes and platelets were isolated from blood collected from healthy donors as described in [22]. The cells were seeded on a seahorse XF96 plate to assess bioenergetic function with a seahorse extracellular flux analyzer. Basal oxygen consumption was determined, followed by sequential injections of oligomycin, FCCP and antimycin A. The OCR was normalized to total protein based on number of cells plated per well. (A) Indices of bioenergetics were determined in monocytes, lymphocytes and platelets from individual donors. n=9–10. (B) Mitochondrial respiratory chain complexes and TCA cycle protein expression in each cell type were determined by western blotting for cytochrome c oxidase subunit I and Reiske iron–sulfur protein and citrate synthase. Isolated cells were solubilized in RIPA buffer and 50 µg of protein was resolved in SDS PAGE gels followed by western blotting. Data presented as mean±±SEM n=3 independent donors. *p<0.05 and **p<0.005.