
Fig. 2.
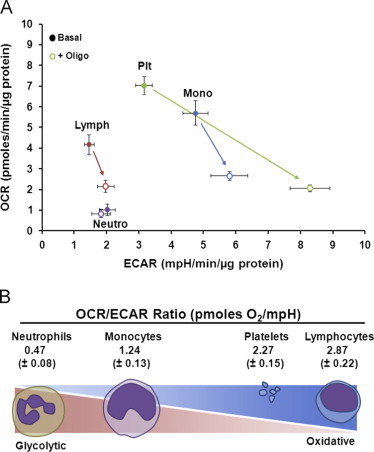
Distinct glycolytic metabolism in leukocytes and platelets. Oxygen consumption rate and extracellular acidification rate (ECAR) were measured in isolated monocytes, lymphocytes, platelets and neutrophils from healthy donors. (A) The basal and oligomycin sensitive mitochondrial bioenergetics (OCR) and glycolytic (ECAR) rates are plotted for each cell type. (B) The basal OCR/ECAR ratio is shown plotted at the approximate position showing the relative use of glycolysis (100% on the left) and oxidative phosphorylation (100% on the right). Data presented as mean±SEM n=9–10 independent healthy donors.