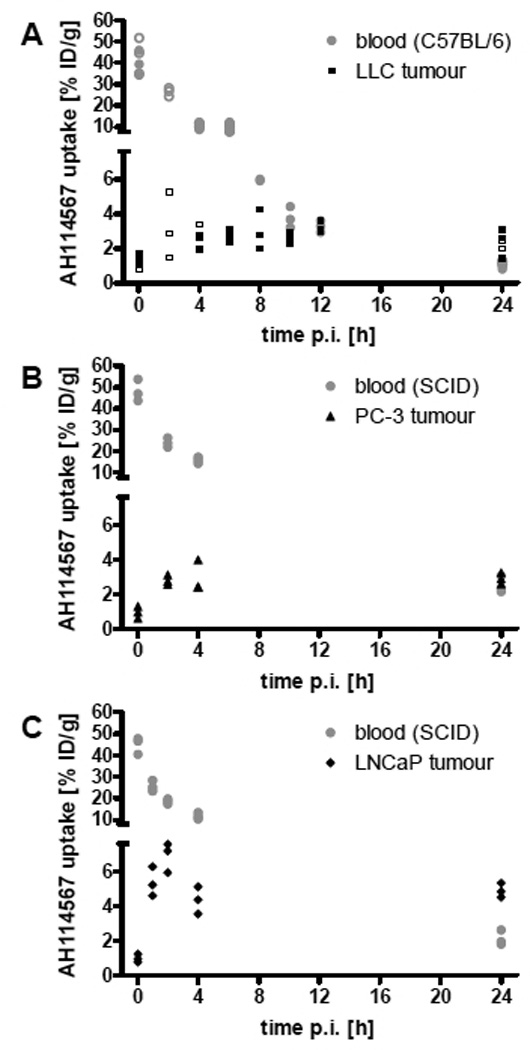
FIGURE 3.

99mTc-AH114567 uptake in % ID/g in (A) LLC, (B) PC-3, (C) LNCaP model. Circles: uptake in blood, triangles: uptake in tumour, open symbols: repeat study of selected time points. N=3 per study. Displayed are individual animal data (2 outliers removed). The two segments of the ordinate end and start at 7.6% ID/g, respectively.
