
FIGURE 6.
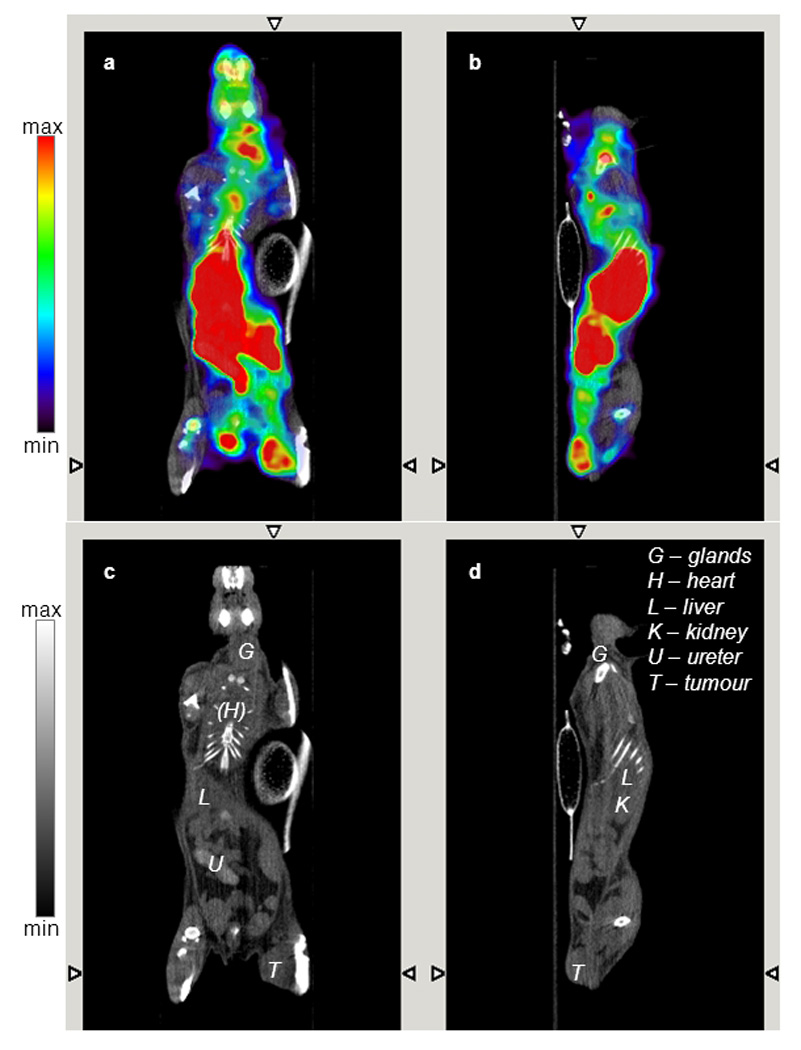
Fused SPECT/CT (panels A, B) and CT only images (panels C, D) acquired 22 h post i.v. injection of 128 MBq 99mTc-AH114567 in a C57BL/6 mouse with LLC tumour in the right thigh (ca. 6 mm · 5 mm · 4 mm). Coronal (panels A, C) and sagittal view (panels B, D). CT images are contrast enhanced (late phase, see hyperintense ureter/bladder).