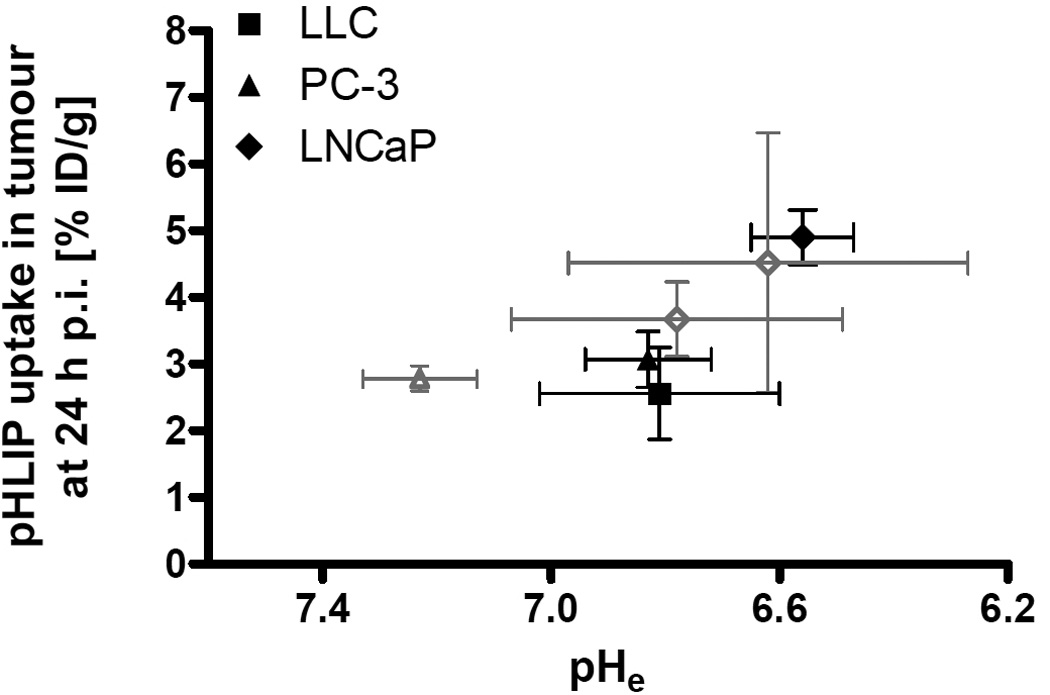
FIGURE 7.

Mean pHLIP uptake in tumour [% ID/g] versus mean pHe for 99mTc-AH114567 (different animal batches for both measures; closed symbols in black) and for 64Cu-DOTA-pHLIP (same animals for both measures; open symbols in grey; triangle: PC-3, diamonds: LNCaP; [8]).
