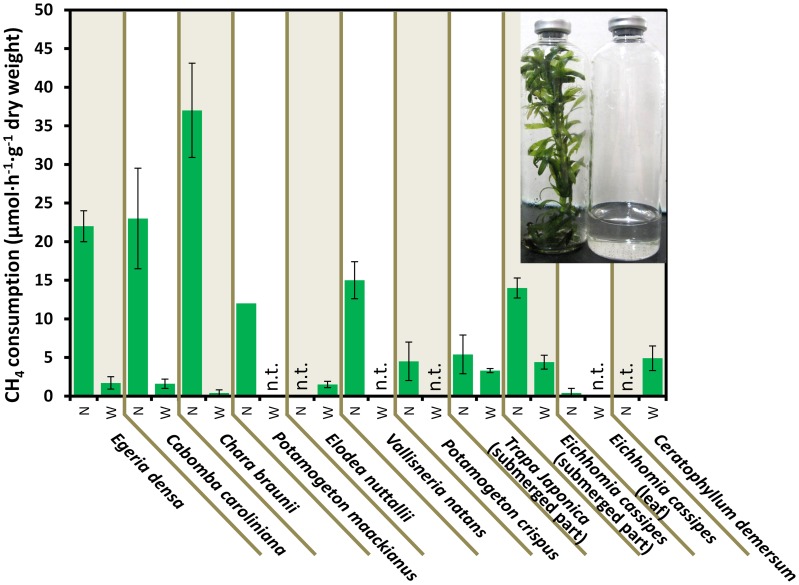
Figure 2.
CH4 consumption in the aquatic plants. Data represent the mean ± SD from three different glass bottles independently prepared in parallel, except for the single determination with P. maackianus. The photo shows the incubated E. densa (left) and lake water (right) in bottles. N and W indicate unwashed native samples and samples washed by shaking three times in lake water, respectively. “n.t.” is “not determined.”

