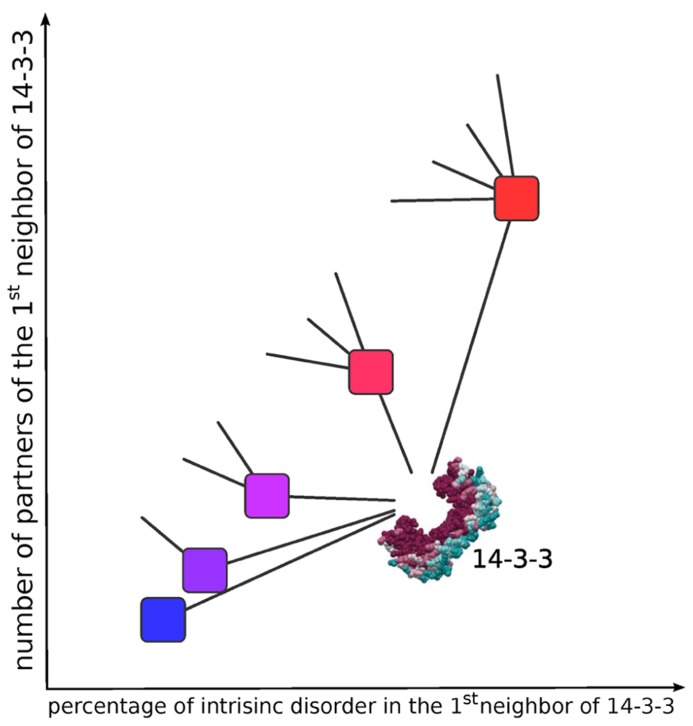
FIGURE 3.
Schematic representation of the relationship between the intrinsic disorder content and the number of neighbors in protein–protein interaction networks. Higher intrinsic disorder content is associated to a higher number of connections (edges) of each node, resulting in higher clustering coefficients. To simplify, only one hub (14-3-3) with five hypothetical first neighbors are diagrammed. The color in the first neighbors of 14-3-3 corresponds to the degree (percentage) of intrinsic disorder content (less disordered = blue to more disordered = red). The less disordered node (blue) has only one connection (edge) to 14-3-3, and the most disordered node (red) has 5 edges, one to 14-3-3 and the other four connected to other (not diagrammed) partners.

