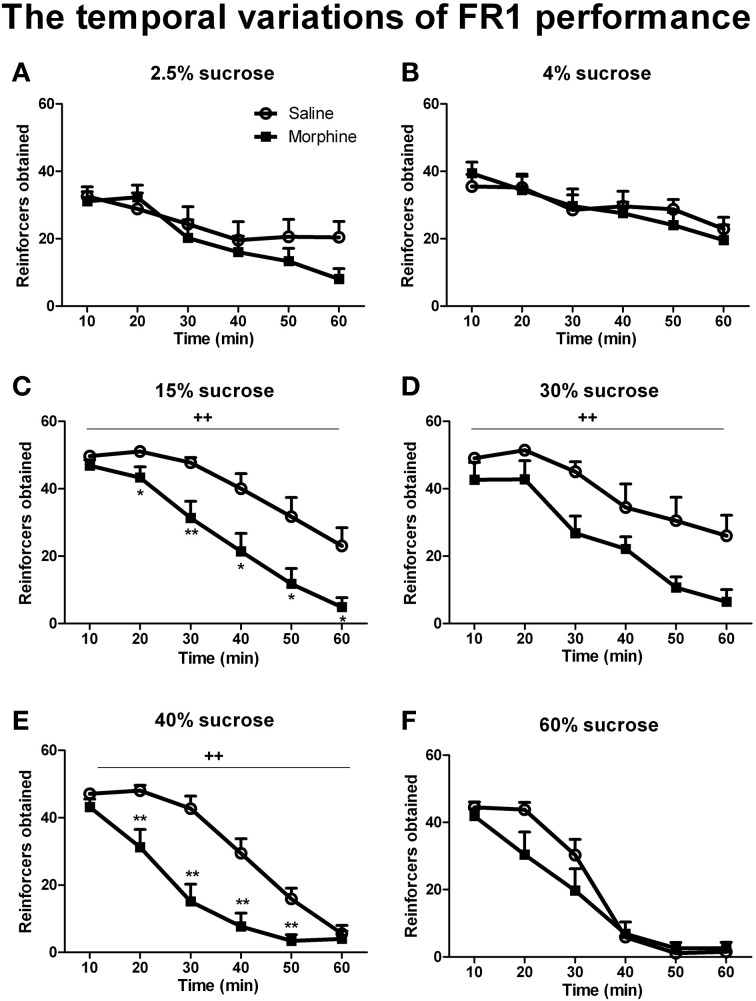
Figure 5.
Number of reinforcers obtained across the 1-h FR1 session (10 min/block). Rats were reinforced by sucrose solutions with different concentrations of 2.5% (A), 4% (B), 15%(C), 30% (D), 40%(E), or 60% (F). Values represent the solution delivered. *P < 0.05, **P < 0.01, relative to saline group tested with the same concentration of sucrose solution. ++P < 0.01, a significant main effect of pretreatment. Values are mean ± s.e.m.

