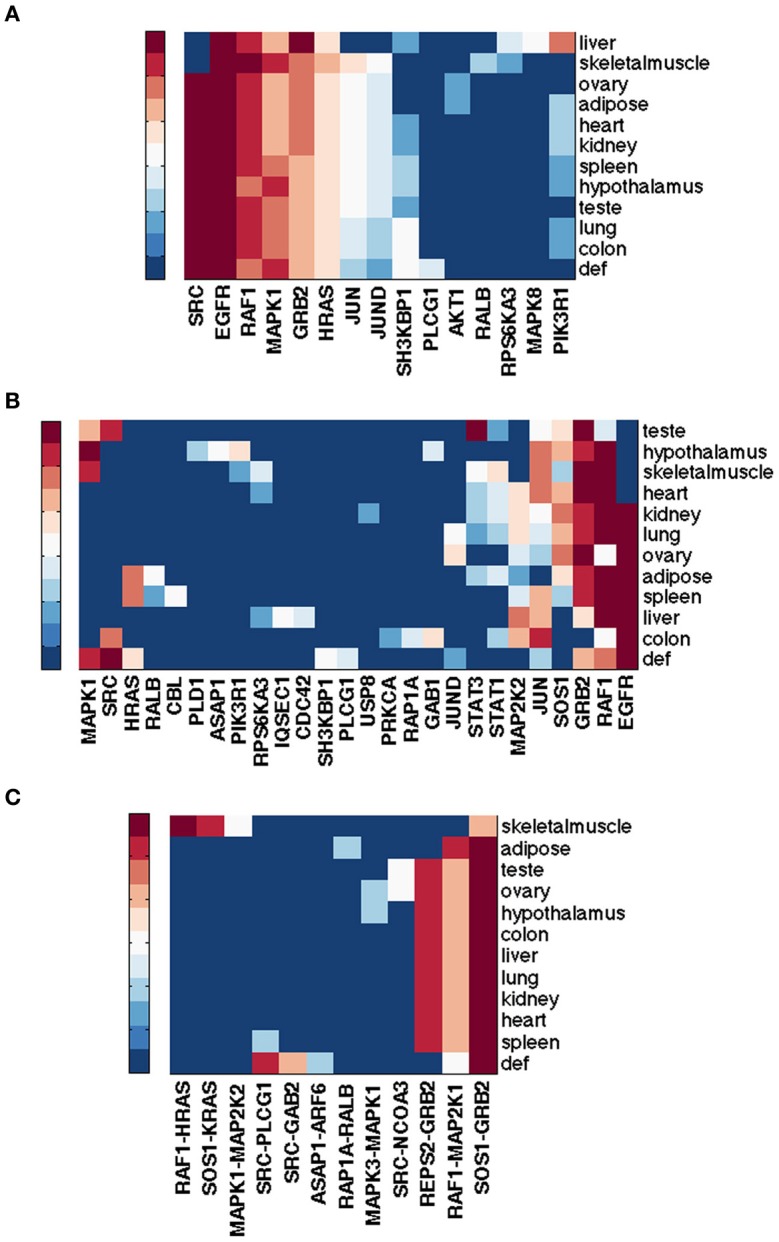
Figure 4.

Top ranked nodes of EGFR pathway conditioned on eleven normal human tissues from RNA-Seq Atlas. Ranks range from 1 (dark red) to 10 (blue), and > 10 (the darkest blue) for (A,B); from 1 (dark red) to 5 (blue), and > 5 (the darkest blue) for (C). (A) Node ranking by spectral gap centrality crs(h = 2) with RPKM ≥ 0.5. (B) Node ranking by spectral gap centrality crs(h = 2) with RPKM ≥ 3.0. (C) Edge ranking by betweenness erb with RPKM ≥ 0.5
