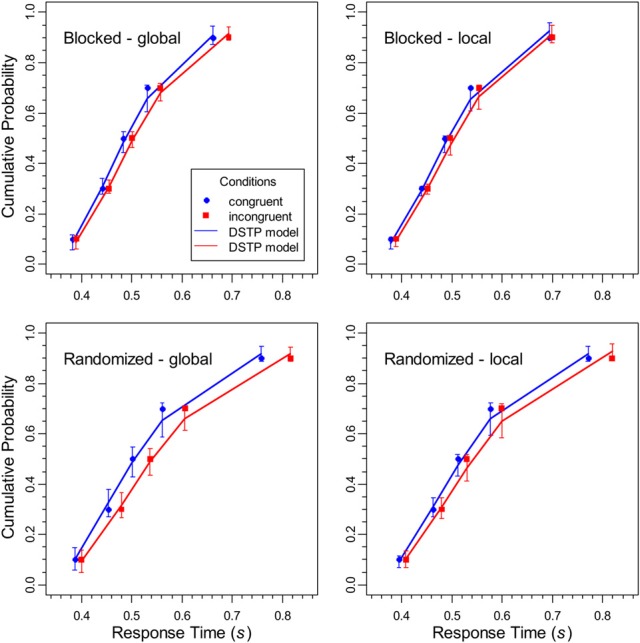
Figure 3.

The data points represent the cumulative distribution functions for the RTs of correct responses for the different conditions in the experiment, whereas the solid lines show the respective performance of the DSTP model. The error bars represent the 95%-confidence intervals of the theoretical function, estimated from the results of the jackknife procedure.
