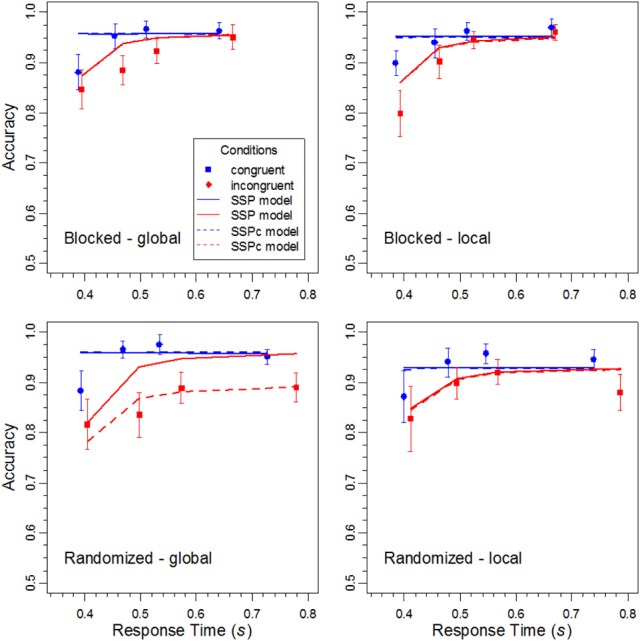
Figure 7.

The data points represent the conditional accuracy functions for the different conditions in the experiment, and the error bars show the respective 95%-confidence intervals. The solid and dashed lines represent the performance of the SSP model and SSPc model, respectively.
