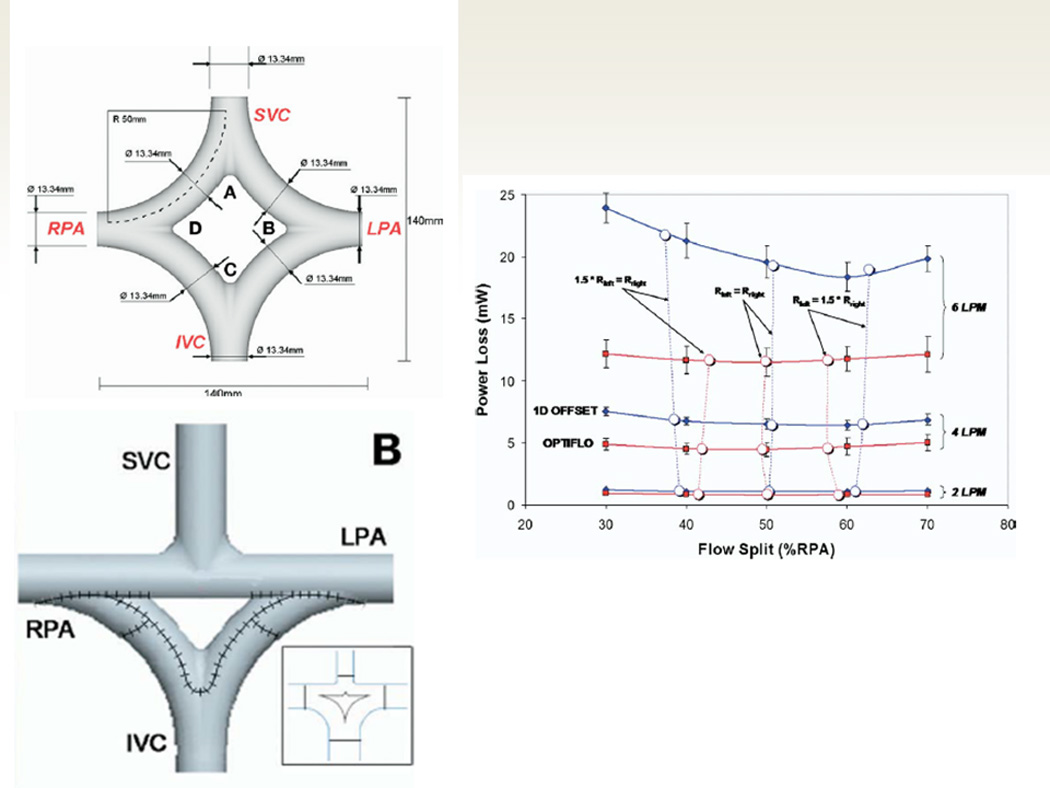
Figure 7.

The “Optiflow” design. Upper left panel demonstrates the diamond shape baffle configuration from the superior vena cava (SVC) and inferior vena cava (IVC) to the right (RPA) and left pulmonary arteries (LPA). The right panel demonstrates CFD modeling results with powerloss on the Y axis and flow split to the RPA on the X axis with the optiflow design performance on in red and the standard Fontan using a 1D offset (SVC and IVC baffle connection separated by 1 diameter) in blue. Note that at 2 liters per minute (LPM), the curves are nearly superimposed, however, at 4 and 6 LPM, the optiflow outperforms the standard Fontan (less power loss at any flow split to the RPA). The lower left panel shows a modification to the optiflow where the IVC baffle has a “Y” split (“Y” graft) but the SVC is not split (a triangle configuration), making it an easier Fontan to create. From Soerensen D, Pekkan K, de Zélicourt D, Parks J, Kanter K, Fogel M, Yoganathan AP. Introduction of a New Optimized Total Cavopulmonary Connection. Annals of Thoracic Surgery. 2007;83:2182–2190. With permission.
