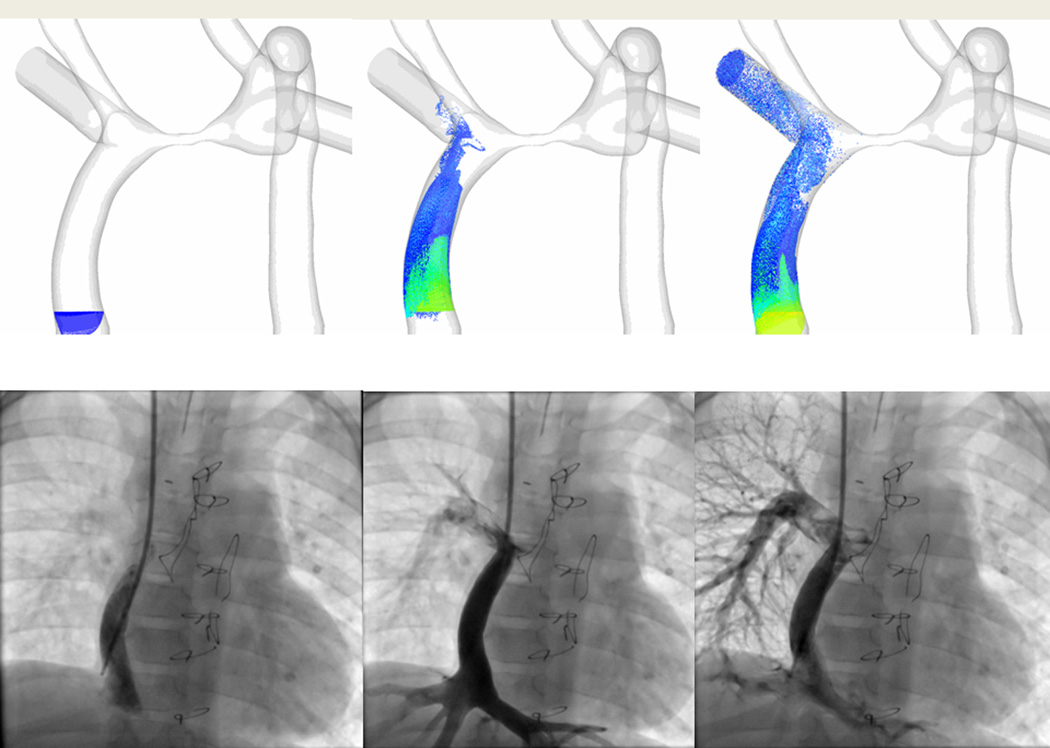
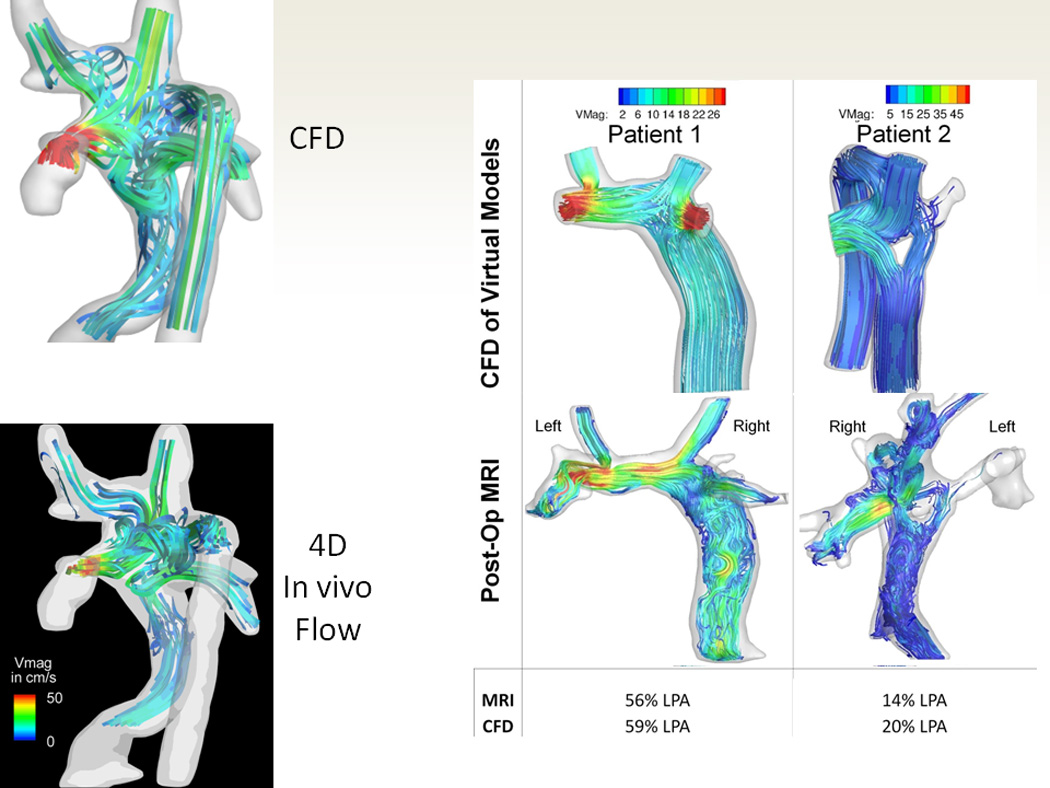
Figure 8.


Validation of the technique. (A). The 3 images on top are 3 phases (going in chronological order from left to right) of particle tracking with CFD in an SV patient with heterotaxy and interrupted IVC with azygous continuation to an LSVC after bilateral bidirectional Glenn and hepatic baffle. Particles are released in the hepatic baffle (left) and followed (middle and right). Bottom are 3 images of 3 phases (going in chronological order from left to right) from a catheterization in that same patient with the catheter at the base of the hepatic baffle. Note how the CFD is nearly identical to the angiography. (B) The top left is CFD modeling of the flow structure of a patient with heterotaxy and interrupted IVC with azygous continuation to an RSVC and the bottom left is the flow structure in the 4-dimensional flow data obtained in-vivo from that same patient. Note how identical the flow structures appear. The right panel is of 2 patients (one with a standard baffle in middle and Y graft on right) with single ventricle. The top 2 images is CFD modeling after SP and the bottom is the anatomy after surgery with the preoperative flows superimposed on the anatomy; again note how identical the flow structures appear. The bottom part of the panel is a table noting how close the MRI and CFD were to each other from calculated flow splits to the left pulmonary artery (LPA).
