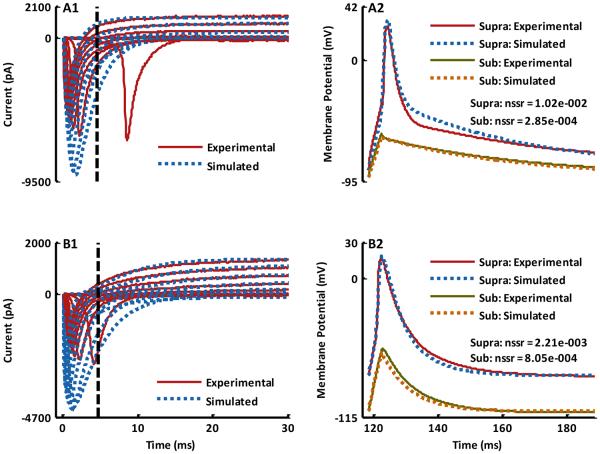
Fig. 3.
A comparison of the simulated results with the experimentally recorded intracellular signals after an optimization of the ion-channel parameters. (A1 and B1) Experimental voltage clamp signals recorded using 10 mV potential steps starting from a holding potential of −85 mV (solid line) and their corresponding simulated voltage clamp signals (dotted line) using optimized ion-channel parameters for Cell 1 and Cell 2 respectively (See Table I, A and B). Currents to the left of the dashed black vertical lines represent inward sodium currents while to the right of the lines outward potassium currents are shown. (A2 and B2) Experimental sub- (solid line) and supra-threshold (solid line) intracellularly recorded current clamp signals from Cell 1 (Sub-threshold current injection, Iinj = 560 pA and supra-threshold current injection, Iinj = 760 pA, Δt = 4 ms ; membrane capacitance Cm = 70 pF ; and, resting membrane potential ) and Cell 2 (Sub- and supra-threshold current injection, Iinj = 1180 pA, Δt = 4 ms; membrane capacitance Cm = 80 pF ; and, resting membrane potential ) respectively. Simulated sub- (dotted line) and supra- threshold (dotted line) intracellular current clamp signals for Cell 1 and Cell 2 using optimized ion-channel parameters shown in Table I, A and B.

