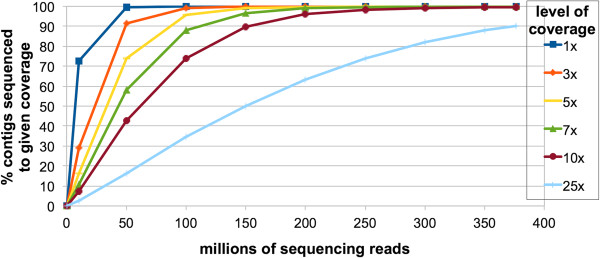
Figure 3.

Sequencing saturation curve. The percentage of contigs with nominal coverage of n-fold (Y-axis) is plotted against the number of sequencing reads (X-axis). Sequencing sub-samples of a given size were randomly selected from the total pool of sequencing reads. Three replicates were performed for each data point. The mean value is shown. The standard error was too small to represent visually on this graph.
