
Figure 2.
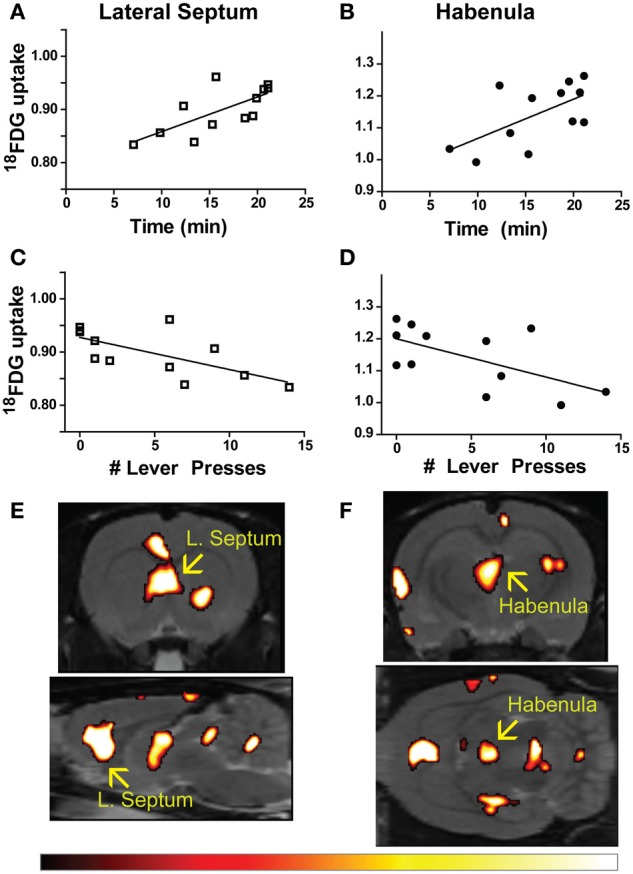
Brain-behavior correlations in learned helplessness. (A–D) Time to finish the test (A,B) and number of lever presses within 20 s of shock onset (C,D) correlated with metabolic activity in the lateral septum (time: r = 0.7131, p = 0.0092; lever: r = −0.6692, p = 0.0173), and habenula (time: r = 0.6138, p = 0.0338; lever: r = −0.6060, p = 0.0367). (E,F) Metabolic activity correlating with time to finish the test visualized with a voxel-by-voxel one sample t-test (p < 0.05), arrows designate the lateral septum (E) and habenula (F) as bright areas overlaid on the T2-weighted rat template using the hot color scale (shown below).