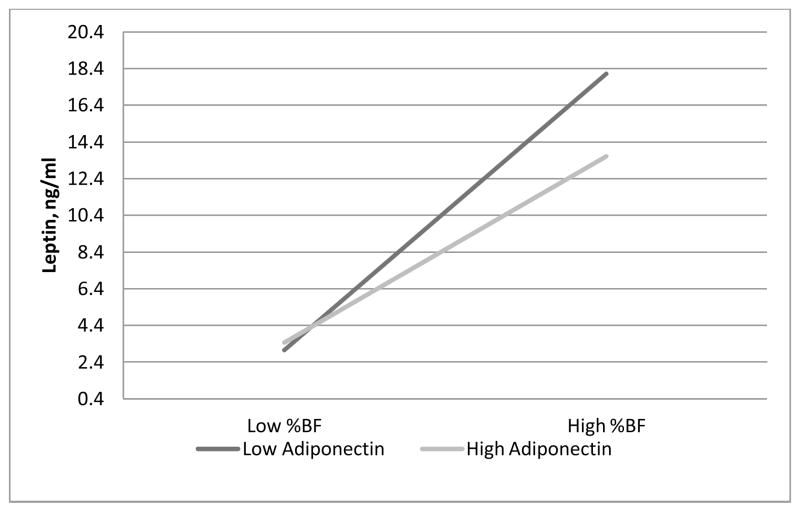
Figure 1.
Plot of the % body fat by adiponectin interaction for leptin (Model R2=0.80; p=0.0220). For graphical purposes, %BF and adiponectin were classified as high if levels fell above the median and low if below. At higher %BF, those with high adiponectin had significantly lower leptin than those with low adiponectin.

