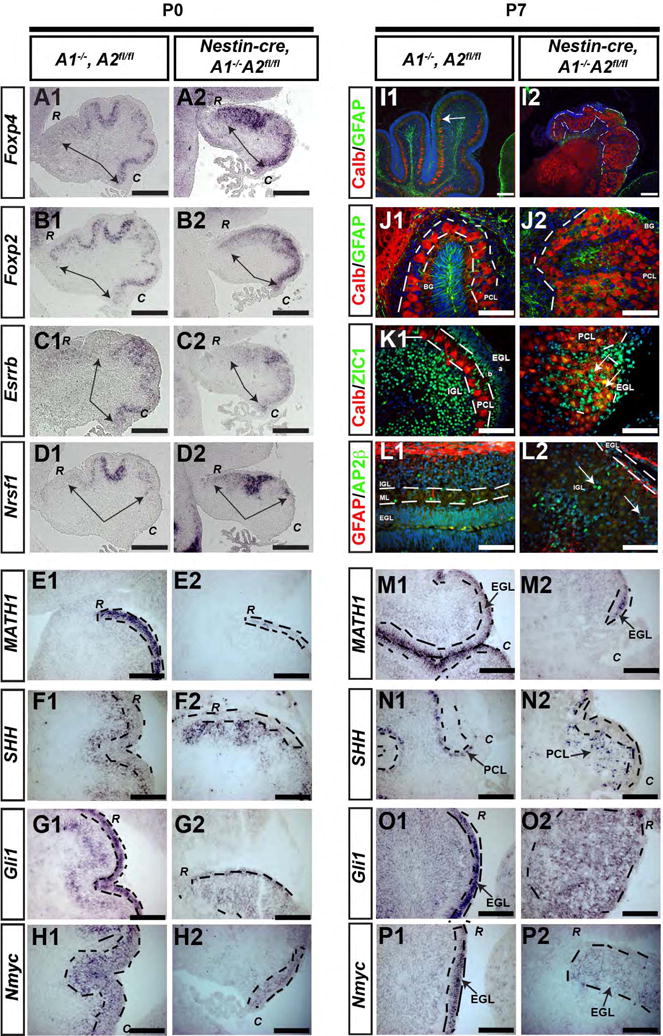
Figure 4. Cytoarchitectural characterization of cerebellar cortex in nestin-cre, A1-/-A2fl/fl mice.

Genotypes and postnatal ages are denoted on the top, molecular markers are denoted on the left. (A-H) P0 mice were sacrificed from control and nestin-cre, A1-/- A2fl/fl mice and evaluated for expression of FoxP4 (A1,A2), FoxP2 (B1, B2), ESRRB (C1,C2), NRSF-1 (D1, D2), SHH (E1, E2), Gli (F1, F2), Math1 (G1, G2), and Nmyc (H1, H2) by in situ hybridization. In panels A-D, the black arrows delineate the expression domain of these patterning genes. In panels E1-H2 and M1-P2, EGL is outlined by the black dashed line. “C” denotes caudal cerebellum, “R” denotes rostral cerebellum. P7 mice were sacrificed from control (I1-P1) and conditional nestin-cre, A1-/-A2fl/fl mice (I2-P2). In panels I-L, blue is DAPI, and the red and green immunofluorescent signals are color coded within each panel. In I1, the linear Purkinje cell layer is denoted by the white arrows, whereas in I2, the patch-like Purkinje cell layer is outlined by white dashed lines. In J1-K2, the white dashed line delineates the PC cell layer. In K2 and L2, interneurons admixed within the patchlike PC layer are illustrated with white arrows. In M2 and O2, “C” denotes caudal cerebellum; in N2 and P2, “R” denotes rostral cerebellum. (In I-K, CALB = calbindin). Scale bars are as follows: A-D = 100 μm, E-H = 50 μm, I1-I2 = 100 μm, M-P = 50 μm. These images represent sections in the sagittal plane and are oriented such that dorsal is superior and caudal is on the bottom right. The abbreviations “R” and “C” in panels A-H and M-P represent high magnification images of rostral or caudal folia, respectively.
