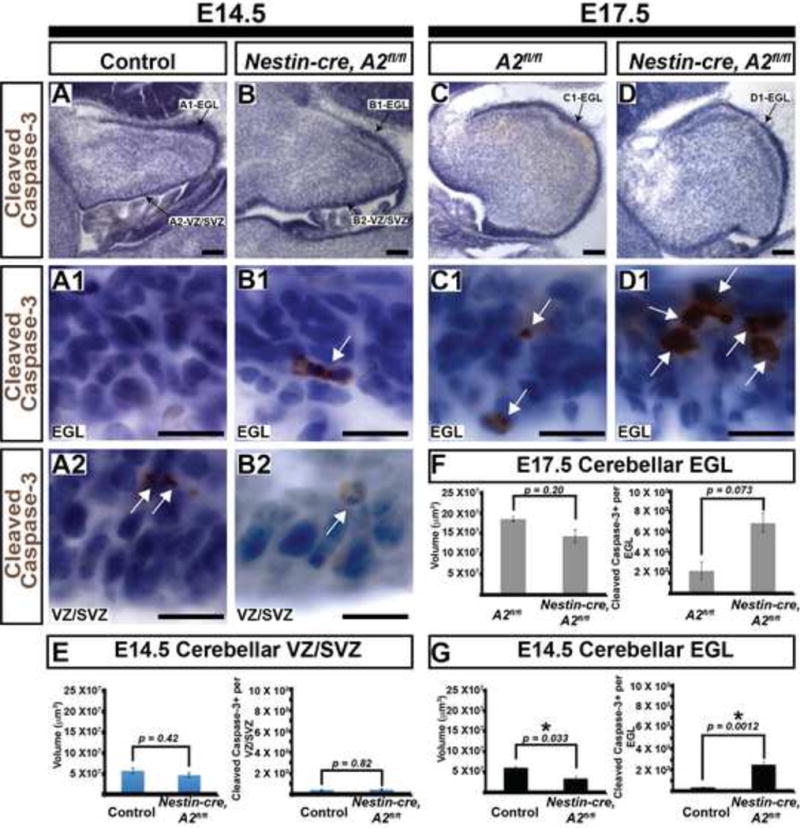
Figure 6. Distinct cerebellar neural progenitor compartments show differential requirements to cyclin A2.

(A-D) Embryonic ages and genotypes are on the top and the molecular marker is on the left. Panels A, B, C, and D illustrate orientation of the pertinent structures quantified in E, F, and G. At E14.5, the EGL shows marked elevation in cleaved caspase-3 and a modest reduction in volume. No statistical difference between total volume and cleaved caspase-3+ cells is noted in the 4th ventricular VZ/SVZ at E14.5 or the EGL at E17.5. (Scale bars in A, B, C, D = 100 μm. Scale bars in A1, A2, B1, B2, C1, D1 = 12.5 μm, EGL = external granule layer, VZ/SVZ = ventricular zone/subventricular zone, * in G denotes statistical significance, scale bars in E, F, G= SEM, p values determined by 2-tailed homoscedastic T-test). White arrows in panels A1, A2, B1, B2, C1 and C2 illustrate cells that are positive.
