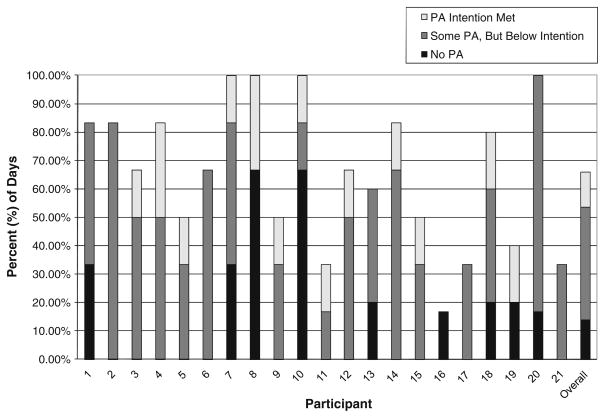
Fig. 1.
Frequency of physical activity intentions and extent to which intended amounts of physical activity were achieved: by participant and across days. White bars PA intention met; gray bars some PA, but below intention; black bars no PA. Note. The total height of the bar represents the percentage of days that each participant intended to be active. The shading represents the degree to which the intended amount of PA was achieved

