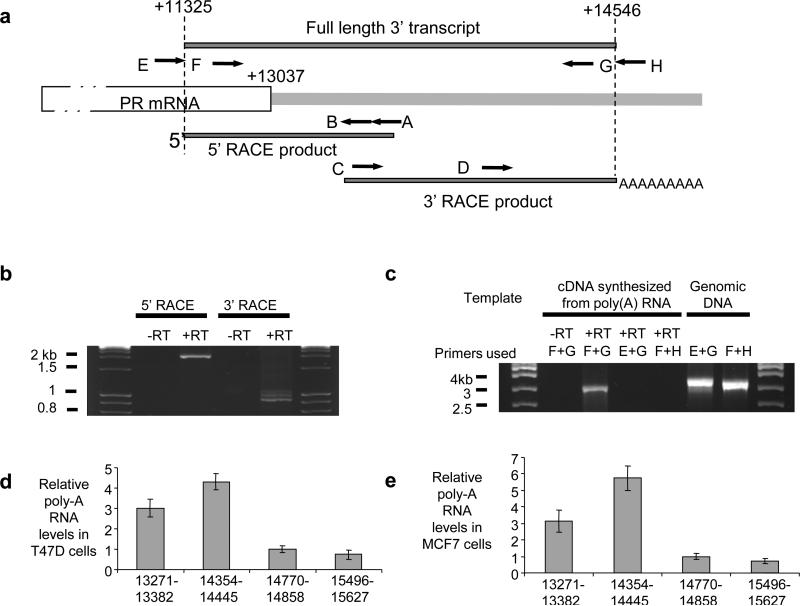
Figure 2. Characterization of the PR 3’ noncoding transcript.
(a) Location of RACE (A,B,C, and D) or RT-PCR (E,F,G, and H) primers relative to PR mRNA and the 3’ noncoding transcript. (b) Agarose gel analysis of RACE products. Total RNA used in RACE was treated with DNase prior to reverse transcription. (c) Agarose gel analysis of RT-PCR amplification using primers E, F, G, and H as shown. Poly(A) RNA was DNase-treated prior to reverse transcription. Amplification of genomic DNA was included as a positive control for primer function. Complete data including sequencing of amplified products is shown in Supplementary Figure S3. qPCR of relative RNA levels in (d) T47D cells and (e) MCF7 cells using primer sets upstream or downstream of the predicted +14,546 termini of the 3’ noncoding transcript (also see Supplementary Figure S1). −RT: RNA samples that were not treated with reverse transcriptase (−RT) were used as negative control. +RT: Reverse transcriptase added. Data is the result of triplicate independent experiments.

