Figure 11.

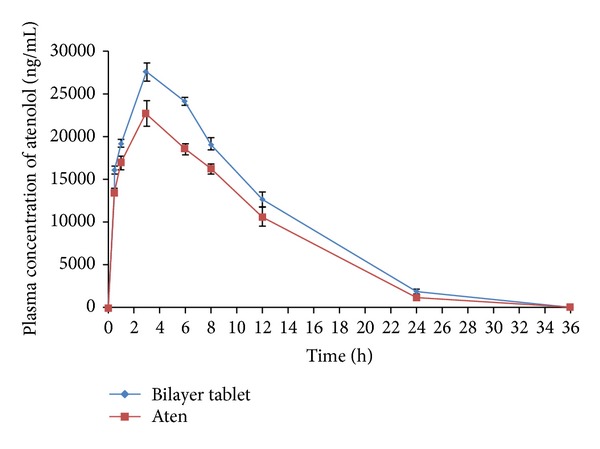
Mean plasma concentration versus time (mean ± S.E.) profile of atenolol following oral administration of marketed ATL sustained release formulation (Aten) and bilayer tablets in healthy rabbits (n = 3).

Mean plasma concentration versus time (mean ± S.E.) profile of atenolol following oral administration of marketed ATL sustained release formulation (Aten) and bilayer tablets in healthy rabbits (n = 3).