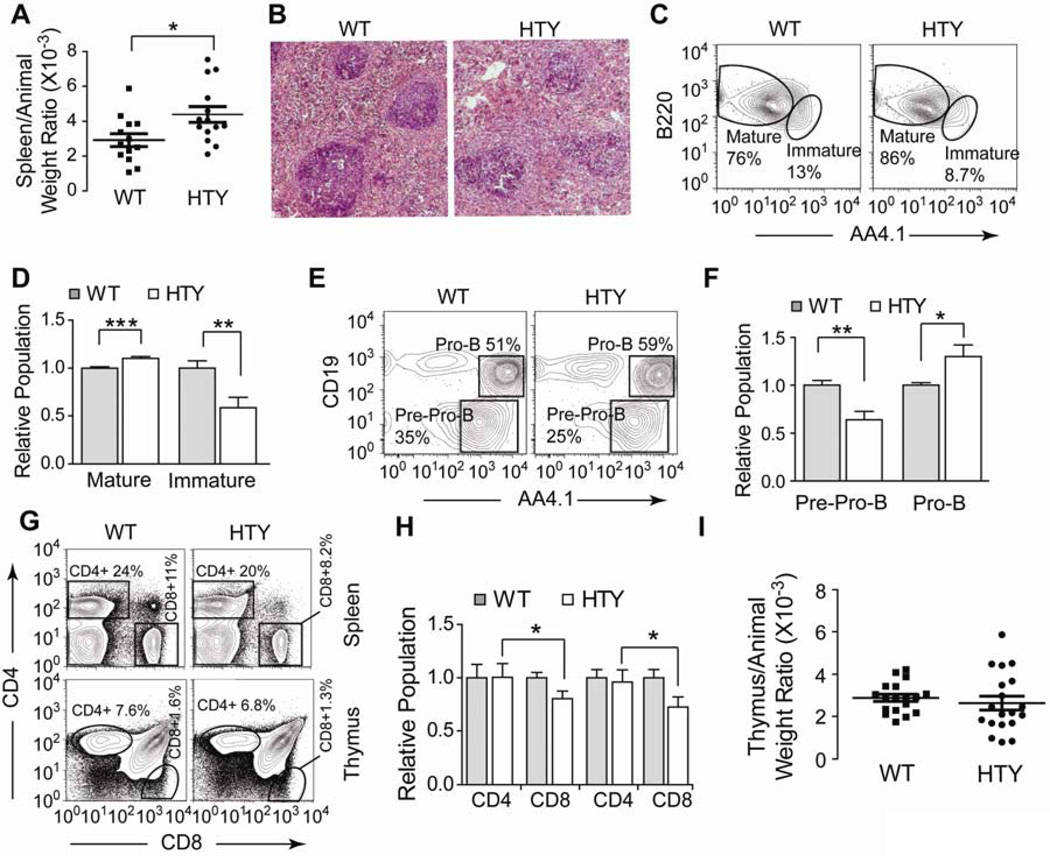
Figure 4. B and T lymphopoiesis in Runx1HTY350-352AAA animals.
(A) At sacrifice, animals were weighed then the spleen and/or thymus was removed and weighed. Displayed is the spleen weight normalized to total animal weight. Each point represents one animal (n=14 WT, 15 HTY). (B) Spleens were formalin fixed, sectioned and then stained by H & E. Representative fields are shown (n=3 WT, 3 HTY). (C) Bone marrow cells from wildtype or Runx1HTY350-352AAA animals were stained for B220, IgM, AA4.1 and CD43. B220 positive and IgM positive cells were gated to show expression of AA4.1 to separate Immature and Mature B cells. (D) Quantification of multiple experiments performed as in C (n=12 WT, 12 HTY). (E) Bone marrow cells from wildtype or Runx1HTY350-352AAA animals were stained for B220, IgM, AA4.1, Ly6C, CD49b, CD19 and CD43. Cells positive for Ly6C, CD49b and IgM were excluded by gating, and the CD43+ B220+ subset is shown to measure AA4.1+CD19− pre-Pro-B cells and AA4.1+ CD19+ pro-B cells. (F) Quantification of multiple experiments as in E (n=6 WT, 6 HTY). (G) Spleen or thymus cells were isolated and stained with CD4 and CD8. Spleen cells were gated and plotted as CD4 versus CD8 to measure CD4+ and CD8+ T cell populations. (H) Quantification of multiple experiments as shown in G (n=12 WT, 14 HTY; age-matched animals were used). (I) Displayed is the thymus weight normalized to total animal weight (n=18 WT, 19 HTY). * p<0.05, ** p<0.01, *** p<0.001, calculated by Student’s T test. All error bars are SEM.

