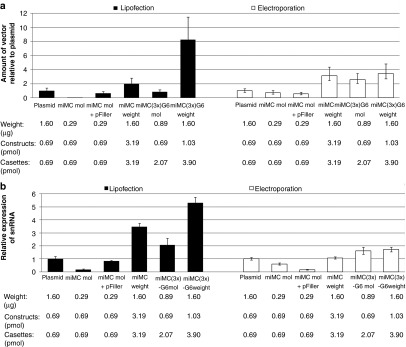
Figure 6.

Studying the effect of different transfection methods on splice-correction effect from the micro-minicircle (miMC) construct and from miMC(3x)-G6 to plasmid in vitro in HeLaLuc705 cells, assayed after 24 hours (n = 3): Lipofection by Lipofectamine 2000 and electroporation using the Neon Transfection System. (a) Amount of vector DNA measured by qPCR for the expression casette, as compared to transfections with plasmid and equilibrated to genomic copy numbers by quantification of the Tfrc gene. Data shown as mean + SEM. (b) Expression of splice-correcting 705 snRNA from miMCs as determined by qPCR and equilibrated against the endogenous control RNU24 in HeLaLuc705 cells and normalized to the expression from 1.6 µg plasmid. Labels: weight (µg), vector (pmol), and casettes (pmol) refers to values for splice-correcting vector also when filler DNA is added. Data shown as mean + 95% confidence interval.
