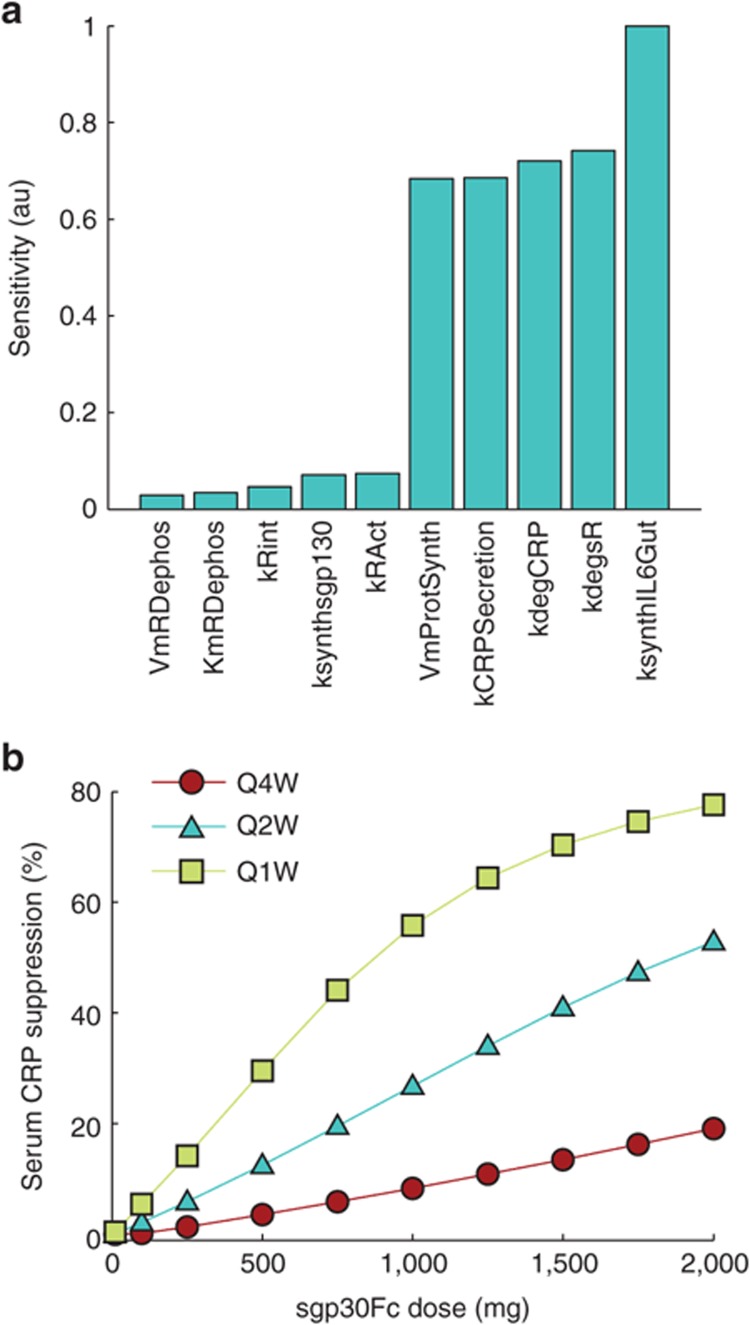
Figure 6.
Evaluating other targeting strategies. (a) Sensitivity analysis was performed on the model to assess which parameters had the greatest influence on the steady-state values of a set of output biomarkers. Parameters to which the output was least and most sensitive are shown. (b) The response to sgp130Fc in terms of serum CRP suppression from baseline increased linearly with dose except for the Q1W schedule where it showed a tendency to saturate at higher doses. CRP, C-reactive protein; Q1W, every 1 week.

