Abstract
Shedding of a pharmacological target from cells, giving rise to a soluble target that can also bind therapeutic proteins, is a common phenomenon. In this study, a minimal physiologically based pharmacokinetic model was used to simulate the pharmacokinetics of trastuzumab and the simultaneous binding of the compound to soluble (in blood and tissue interstitial space) and membrane-bound (in the tissue interstitial space) forms of human epidermal growth factor receptor 2 (HER2). The parameter values describing binding of trastuzumab to HER2 were largely derived from in vitro data, and the effects of varying HER2 levels, the affinity difference between membrane-bound HER2 and shed antigen, and slow binding kinetics were investigated. The model simulates a sharp decrease in trough drug concentrations at concentrations of soluble target between 500 and 1,000 ng/ml in plasma. This corresponds with the clinical concentration range of soluble target wherein changes in half-life of trastuzumab have been observed.
At steady state, the level of a therapeutic target is maintained by its rates of synthesis and degradation. When a drug binding to the target is introduced into the system, changes in the target level are often modeled dynamically using modifications of an enzyme turnover model.1,2 Examples of this type of modeling are the pharmacodynamic indirect response model and models describing target-mediated drug disposition (TMDD).3
However, in reality, the target dynamics are often more complex than can be accounted for by a single turnover model. For instance, it has been postulated that most membrane-bound proteins shed their ectodomains (ECDs) to some degree,4 with both membrane-bound and soluble forms of a target coexisting in various parts of the body. Kuang et al.5 divided the therapeutic monoclonal antibodies (mAbs) approved by the US Food and Drug Administration into three categories based on the characteristics of their target antigens: (i) membrane-bound cell surface target, with minimal or no shedding of the target protein; (ii) membrane-bound cell surface target that sheds its ECD or has a soluble form in the systemic circulation; and (iii) circulating soluble targets, such as cytokines and growth factors.
Examples of targets of therapeutic proteins that exist as both membrane-bound and soluble forms include cell surface antigens on lymphocytes such as cluster of differentiation (CD) 20 (rituximab, ibritumomab, and tositumomab), CD25 (basiliximab and daclizumab), and CD52 (alemtuzumab).5 Both the epidermal growth factor receptor, targeted by cetuximab and panitumumab, and the human epidermal growth factor receptor 2 (HER2), targeted by trastuzumab, exist as both membrane-bound forms in the interstitial space of tissue and as a soluble form in the interstitial space and plasma as a result of shedding.6 The levels of circulating target can be influenced by disease, and significant attention has been given to the measurement of shed antigen concentration in the blood and its correlation with clinical response.7,8 For example, much higher levels of circulating CD20 are reported in patients with chronic lymphocytic leukemia and non-Hodgkin's lymphoma (up to 15 μmol/l) compared with that in healthy subjects (124–547 nmol/l);9,10 similarly, higher plasma levels of shed HER2 ectodomain (ECDHER2) have been detected in cancer patients (2.21 µg/ml) compared with those in healthy subjects (<15 ng/ml).7,11 Although it is technically difficult to measure the levels of shed antigen in the tumor interstitial space, it can be expected that the concentration would be considerably higher than that in the blood.12
The coexistence of shed antigens in different physiological compartments of the body (i.e., blood and interstitial space), which can influence the binding of a drug to the pharmacological (membrane-bound) target, results in a complex scenario where the receptor occupancy of the membrane-bound target can be influenced by the levels of the soluble receptor, the drug concentration in the plasma and interstitial space, the relative potency of the drug for the soluble and membrane-bound receptor, and differences in the kinetics of binding to the soluble and membrane-bound receptors.
To understand the influence of some of these factors on membrane-bound receptor occupancy, a modeling approach was used, and the models describing TMDD were extended to account for target shedding within the framework of a minimal physiologically based pharmacokinetic (PBPK) model for mAbs. In the model, the pharmacological target exists both as a membrane-bound form and as a shed soluble protein in the tissue interstitial space and plasma. The extended TMDD model was used to simulate the kinetics of trastuzumab in the presence of shed HER2 target protein.
Results
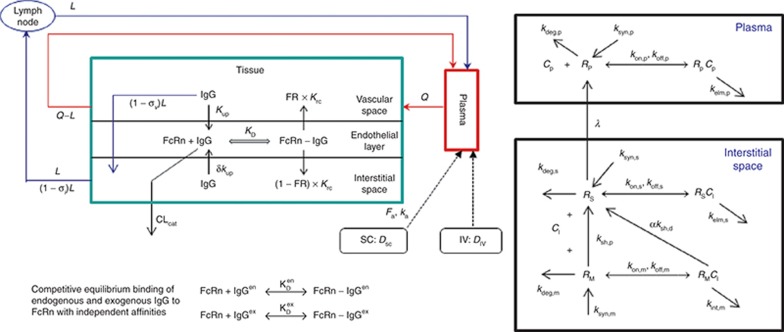
The structure of the minimal PBPK model incorporating target-shedding models is shown in Figure 1. The shedding model was formulated to work with the full TMDD model originally described by Mager and Jusko3 and also with the quasi-steady-state (QSS) approximation described by Gibiansky et al.13 Similar results were obtained using the extended full TMDD model and the QSS approximation (see Supplementary Material). For brevity, only the simulations with the QSS model are discussed here.
Figure 1.
Left panel: the structure of the minimal physiologically based pharmacokinetic model. Right panel: schematic representation of the target-mediated drug disposition model incorporating shedding mechanisms. RM is the membrane-bound target, RS is the shed soluble target in the interstitial space, and RP is the soluble target in plasma. Synthesis and degradation rates for both RS and RP are included to allow for other possible mechanisms of soluble receptor formation, in addition to shedding, to be considered. Before dosing of drug, these species are assumed to be at equilibrium, representing the baseline physiological or pathophysiological status of the subject, and when a drug is administered, this equilibrium system is disturbed by drug–target binding and subsequent elimination of formed complexes. IgG, immunoglobulin G; IV, intravenous; SC, subcutaneous.
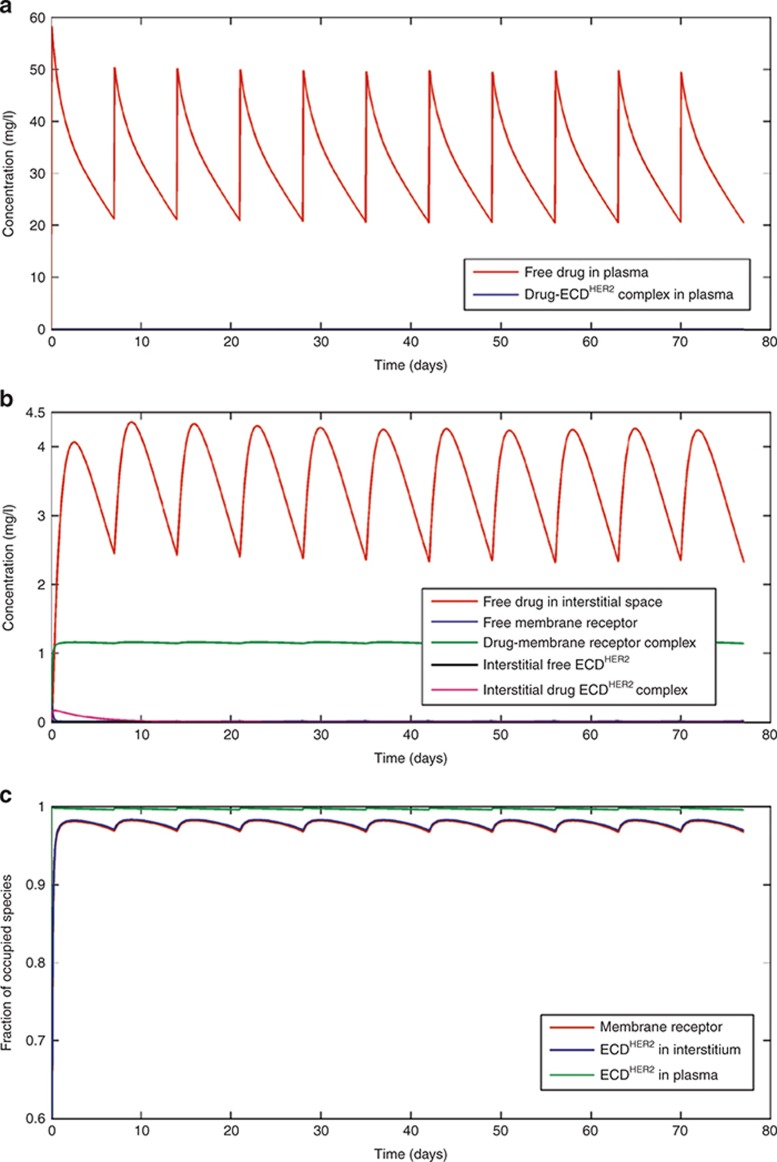
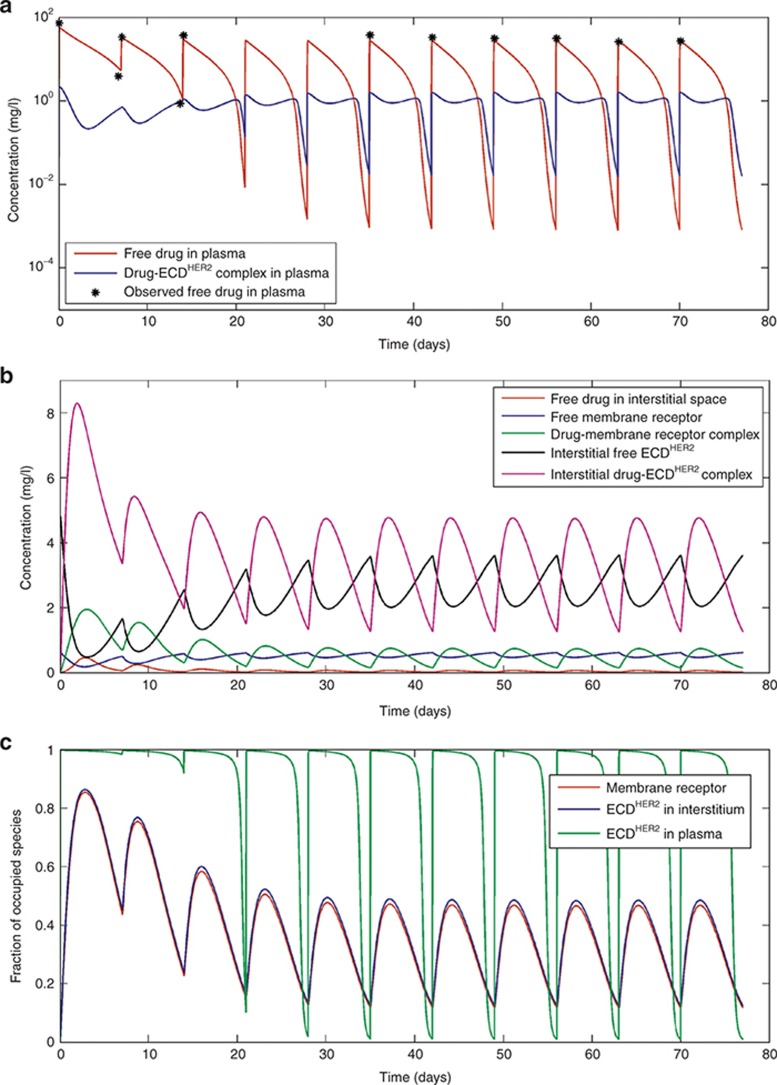
Figure 2 shows simulations when the shedding rate of HER2 is low, corresponding to the relatively low levels of ECDHER2 (14.6 ng/ml) seen in the circulation of healthy volunteers.14 As shown in Figure 2a–c, this low level of ECDHER2 has little effect on the pharmacokinetics (PK) of the drug in the plasma or interstitial space, and the standard dose scheme of a 4-mg/kg loading dose, followed by a 2-mg/kg weekly dose, achieves high target occupancy of the membrane-bound receptor throughout the dose period. The trough concentration of free drug in plasma is 22 mg/l, which is greater than the targeted 10–20 mg/l determined from preclinical studies.15,16,17 The results of this simulation are also consistent with a published population PK study.18 A plasma trastuzumab concentration profile for a patient with a serum ECDHER2 level greater than 700 ng/ml in plasma was presented in studies by Baselga et al.15,19 Because no specific value of ECDHER2 level was given for this profile, simulations were performed with a shedding rate (ksh,p = 0.138 h−1) calibrated such that the simulations matched the observed data. This shedding rate leads to a corresponding initial plasma ECDHER2 level of 878 ng/ml. At this concentration of ECDHER2, the simulated PK of trastuzumab become markedly multiphasic (Figure 3a). In the clinical study, the lower limit of quantitation of trastuzumab was 156 ng/ml, and therefore measured trough values are only available for the first two doses. Although this makes it difficult to verify the simulated trough levels, the simulated levels are below the quantification limit of the assay and the simulation was able to accurately capture the slope of the decrease in the trough levels of the observed clinical data. At this higher level of ECDHER2, the level of free drug in the interstitial space is significantly lower than the level of free interstitial ECDHER2 (Figure 3b), and the membrane-bound target occupancy is reduced significantly compared with that in previous simulations (Figure 3c).
Figure 2.
Simulations based on the standard dosing scheme in the clinical trial described in Bruno et al.18: 4-mg/kg loading dose and then 2-mg/kg dose weekly by an intravenous infusion of 90 min for each dose. Panels (a), (b), and (c) respectively show the concentrations of drug and complex in the plasma, the interstitial space, and the fraction of the occupied receptor at the membrane, in the interstitial space, and in plasma. Simulations were performed with a shedding rate (ksh,p) of 0.0023 h−1, corresponding to an initial level of ECDHER2 in plasma of 14.6 ng/ml. ECD, ectodomain.
Figure 3.
Simulations based on the standard dosing scheme in the clinical trial described by Bruno et al.18: 4-mg/kg loading dose and then 2-mg/kg dose weekly by an intravenous infusion of 90 min for each dose. Panels (a), (b), and (c) respectively show the drug concentration and complex in the plasma, interstitial space, and the fraction of the occupied receptor at the membrane, in the interstitial space, and in plasma. Simulations were performed with a shedding rate (ksh,p) of 0.138 h−1, corresponding to an initial level of ECDHER2 in plasma of 878 ng/ml. The observed clinical data are digitized from the original publication by Baselga et al.15 ECD, ectodomain.
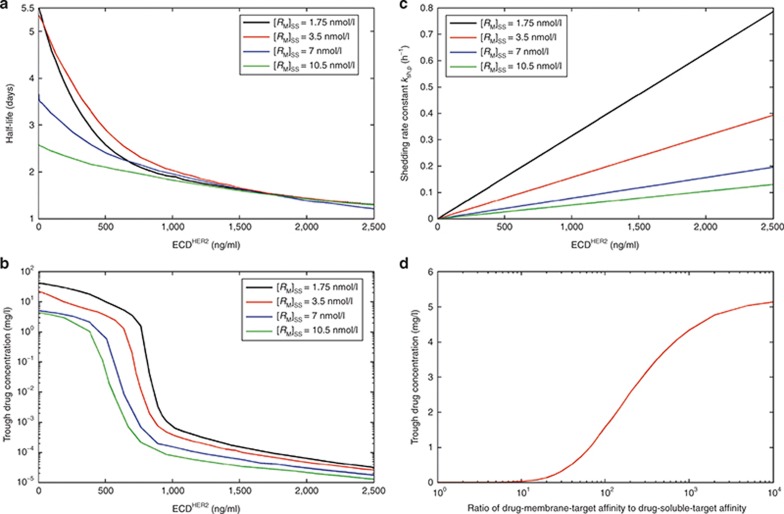
In a phase II study,15 the mean serum half-life of trastuzumab in patients with high circulating ECDHER2 levels (>500 ng/ml) was 1.8 ± 1.0 days and in patients with low circulating ECDHER2 (<500 ng/ml), it was 9.1 ± 4.7 days. The relationship between simulated half-life of trastuzumab (taken from the initial phase of the multiphasic profile) and the plasma level of ECDHER2 in a single individual is shown in Figure 4a. With an estimated membrane-bound HER2 receptor level of 0.0035 µmol/l (see the Methods section for details of the estimation), the half-life decreases from 5.3 to 2.9 days as the ECDHER2 levels increase from 3.18 to 500 ng/ml and from 2.9 to 1.3 days as the levels increase further from 500 to 2,162 ng/ml. Further sensitivity analyses were conducted to show the relationship between trough drug concentration and concentration of ECDHER2 in plasma. A marked dependency of the trough trastuzumab concentration on the soluble HER2 receptor concentration was seen (Figure 4b), with a steep decrease in trough concentration when ECDHER2 concentrations were in the range of 500–1,000 ng/ml in plasma. Changing the level of membrane-bound HER2 receptor shifts the concentration range of ECDHER2 to where the steep decrease in trough plasma levels of trastuzumab is observed, although the shape of the relationship between the trough plasma trastuzumab concentration and soluble receptor concentration is similar.
Figure 4.
Sensitivity analysis based on the standard dose schedule of 4-mg/kg loading dose and then 2-mg/kg dose weekly by an intravenous infusion of 90 min for each dose. Panel (a) shows the effect of altering the shedding rate to give different initial levels of ECDHER2 in plasma (i.e., [RP]SS) on the initial half-life of trastuzumab. Four scenarios are shown wherein the initial concentrations of the membrane-bound receptor are varied over the concentration range of 1.75–10.5 nmol/l. Panel (b) shows the effect of altering the shedding rate to give different initial levels of ECDHER2 in plasma (i.e., [RP]SS) on the trough concentrations of trastuzumab. Four scenarios are shown wherein the initial concentrations of the membrane-bound receptor are varied over the concentration range of 1.75–10.5 nmol/l. Panel (c) shows the linear relationship between shedding rate and initial concentrations of ECDHER2 in plasma applied to the simulations in panels a and b. Panel (d) shows the relationship between trough trastuzumab concentrations and the ratio of binding potency to membrane-bound and soluble forms of receptors. A shedding rate of ksh,p= 0.138 h−1 and target level [RM]SS = 0.0035 μmol/l were used in this simulation. ECD, ectodomain.
The shedding rate constant ksh,p is linearly related to the initial plasma ECDHER2 level (Figure 4c), and this relationship is derived from the steady-state solutions of the system in the absence of drug (Eqs. 18–20 in the Methods section). Figure 4d shows how trough plasma concentrations of trastuzumab are influenced if the binding affinity to the soluble receptor is reduced (less potent) while binding affinity to the membrane-bound receptor is maintained. This analysis shows that under the conditions used, once the affinity ratio reaches 1,000, there is limited improvement in terms of increased trough level with further increases in the affinity ratio.
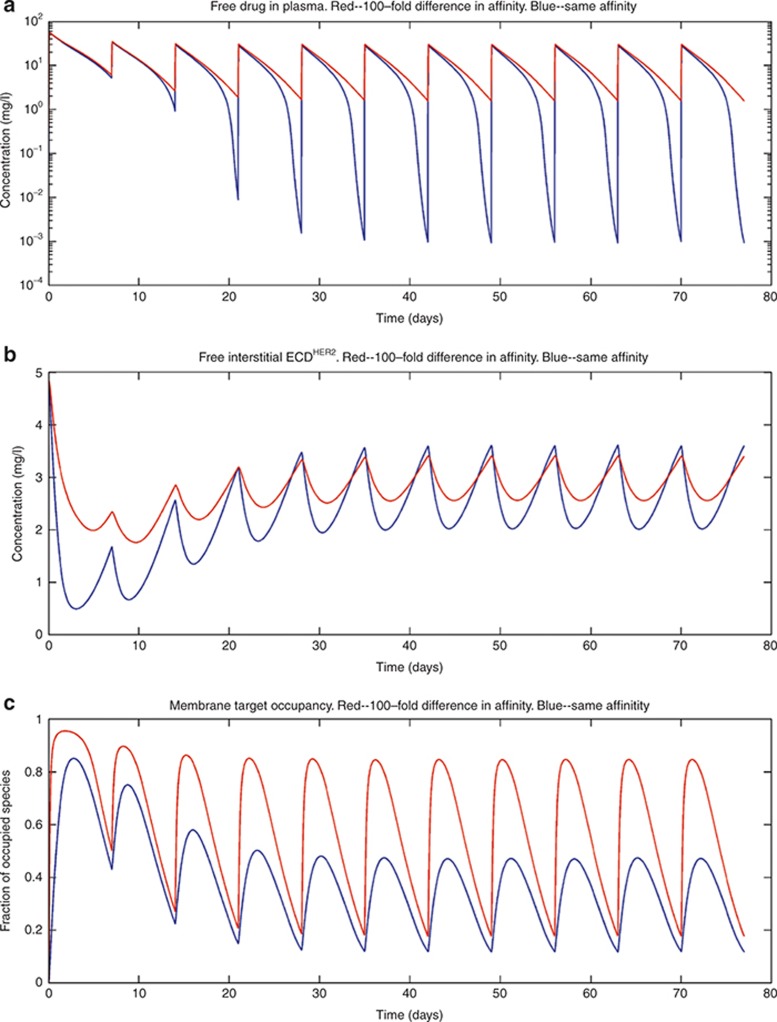
In Figures 5,6,7, the effect of varying some of the model parameters on the simulated outcome is shown. Figure 5 shows that reducing the affinity of trastuzumab to the soluble HER2 receptor by 100-fold while maintaining affinity at the membrane-bound receptor results in higher plasma concentration (Figure 5a), more free ECDHER2 in the interstitial space (Figure 5b), and higher receptor occupancy at the membrane-bound receptor (Figure 5c) even in the presence of high levels of soluble ECDHER2 of 878 ng/ml in plasma.
Figure 5.
The effect of a 100-fold lower affinity of binding to the soluble receptor compared with the binding to the membrane-bound receptor on (a) the plasma concentration, (b) the free soluble receptor in the interstitial space, and (c) the fraction of membrane-bound receptors occupied. Simulations were performed with a shedding rate of ksh,p= 0.138 h−1 and an initial level of ECDHER2 = 878 ng/ml with the standard dosing scheme. The 100-fold reduction of the affinity of the drug toward the soluble target was achieved by increasing the off rates 100-fold (koff,s,koff,p). ECD, ectodomain.
Figure 6.
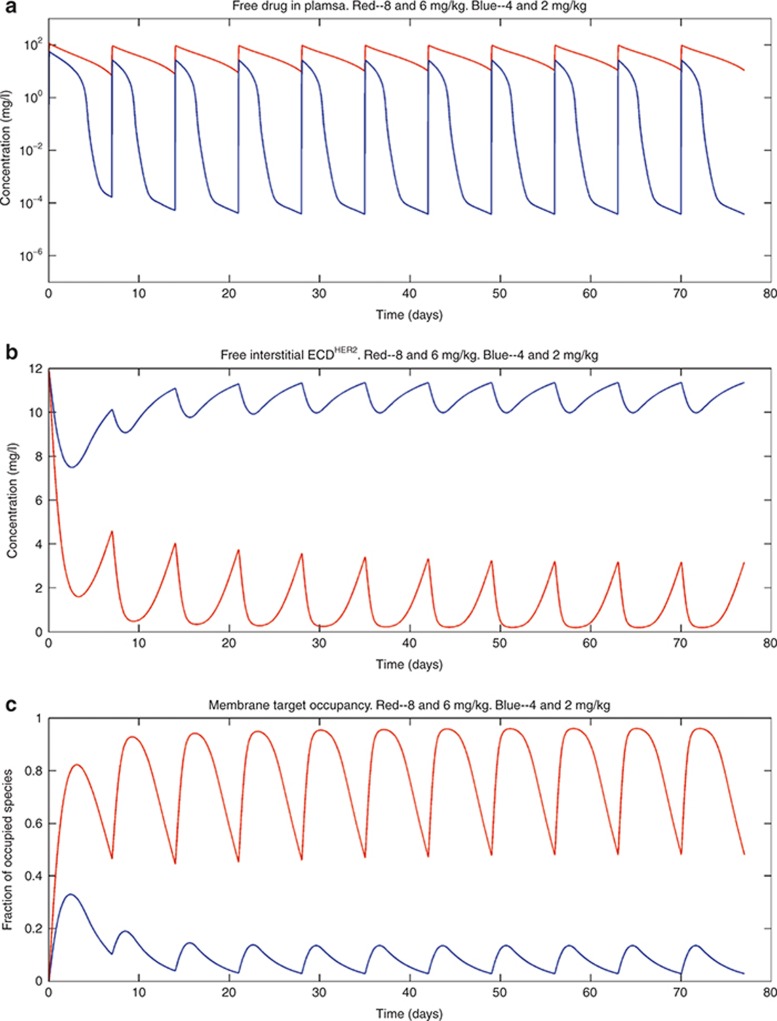
Simulations were performed with two different dosing regimes. Panel (a) shows the simulated outputs in plasma, panel (b) shows the free soluble receptor in the interstitial space, and panel (c) shows the receptor occupancy at the membrane-bound target. The blue curves represent results from a dosing regimen of 4-mg/kg loading dose and then 2-mg/kg dose weekly by an intravenous (i.v.) infusion of 90 min for each dose; the red curves are the results from a dosing regimen of 8-mg/kg loading dose and then 6-mg/kg dose weekly, with i.v. infusion of 90 min for each dose. In these simulations, the shedding rate (ksh,p) was 0.34 h−1 and the initial plasma concentration of ECDHER2 = 2,162 ng/ml, which is close to the maximum observed level of ECDHER2 (2.21 µg/ml) in the clinic. ECD, ectodomain.
Figure 7.
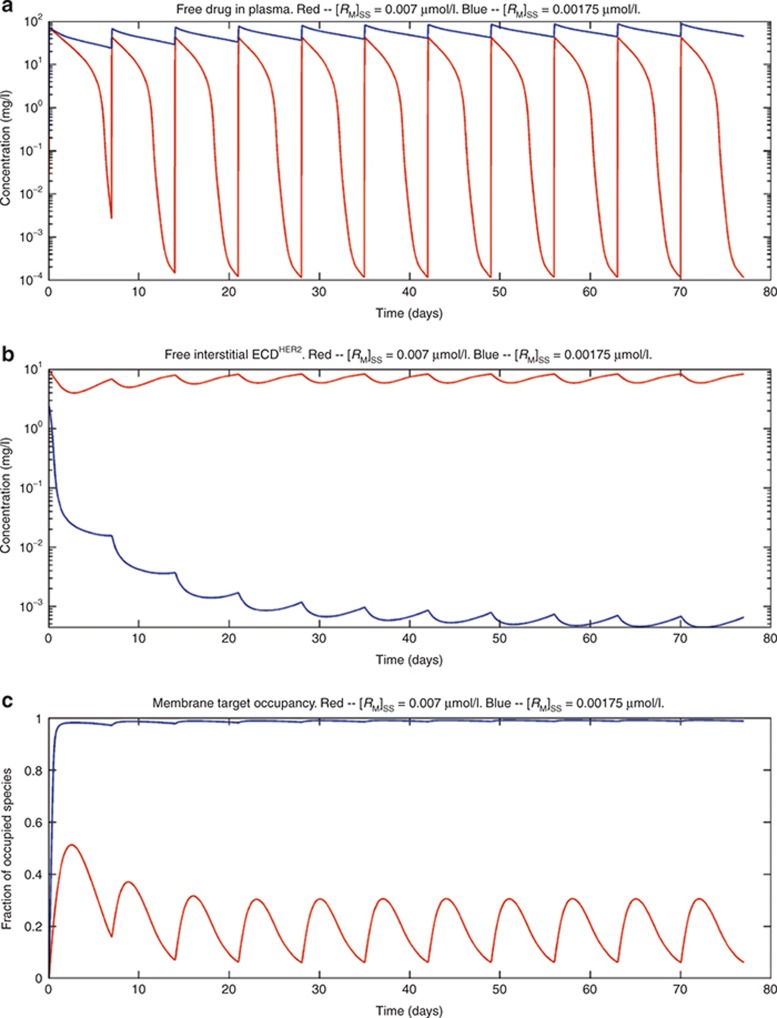
The effect of changing membrane-bound receptor levels on the following: (a) the plasma concentration of trastuzumab; (b) the free soluble receptor in the interstitial space; and (c) the receptor occupancy of the membrane-bound receptor. Simulations were performed with two concentrations of membrane-bound receptor: [RM]SS = 0.007 nmol/l, giving an initial level of ECDHER2 in plasma of 1,755 ng/ml and a half-life of 1.7 days (red line); and [RM]SS = 0.00175 nmol/l, giving an initial level of ECDHER2 in plasma of 43.9 ng/ml and a half-life of 4.5 days (blue line). A shedding rate of ksh,p = 0.138 h−1 and a dosing scheme of a 5-mg/kg loading dose followed by 3-mg/kg dose weekly, with an intravenous infusion of 90 min for each dose, were used in the simulations. ECD, ectodomain.
Figure 6 shows simulations for plasma concentrations of ECDHER2 close to the maximum observed level in patients (2,162 ng/ml).16 Simulations show that when the drug affinity to membrane-bound and soluble targets is the same, increasing the dose of trastuzumab to an 8-mg/kg loading dose, followed by a 6-mg/kg weekly dose, raises the trough plasma level of drug and achieves a higher target occupancy of the membrane-bound receptor. Finally, simulations were also performed to study the effect of varying the level of membrane-bound target. As shown in Figure 7a–c, when the target level is increased fourfold, the drug plasma trough level and the occupancy of the membrane-bound receptor are decreased while the concentration of the free ECDHER2 in the interstitial space is increased.
Discussion
High levels of shed antigen are a common phenomenon in some patient populations. This can complicate the selection of the appropriate dose in these patients because soluble antigen in the interstitial space and plasma can bind to the drug, limiting the amount of drug available to bind to the true pharmacological target, the membrane-bound receptor.
A mechanistic model was developed to describe this phenomenon and to shed light on the complex dynamic interactions between membrane-bound and soluble targets and the drug. The model developed is a natural extension of the full TMDD model described by Mager and Jusko3 and was simplified analogously to the QSS TMDD model described by Gibiansky et al.13 An alternative simplification that was investigated to avoid having to solve Eqs. 32 and 33 in each time step was to derive a Michaelis–Menten type approximation of the full TMDD model with shedding. However, this approximation was found not to be valid because one of the requirements for this simplification (i.e., the derivatives of the complexes are relatively small when compared with the corresponding gradient of free drug concentrations so that the derivatives of total concentrations in the QSS approximation can be replaced by the derivatives of free concentrations) was not met in the simulations with trastuzumab.13 This can be seen in Figure 3b, where the gradient of interstitial drug–ECDHER2 complex is greater than that of interstitial free drug.
To use a model such as the one described herein prospectively (i.e., before clinical data are available for fitting parameters) for new compounds, it would be necessary to either define the parameters for the shedding model from in vitro data or obtain estimate parameters from available preclinical information. Consequently, in the simulation of trastuzumab kinetics, where possible, parameters based on published in vitro measurements were used to describe the TMDD shedding model.20,21,22 In particular, the shedding rate (ksh,p) was specified in a range (from 0 to 0.4 h−1), with the maximum shedding rate chosen based on an in vitro measurement of the shedding rate.23 The resulting range of plasma steady-state concentrations of the soluble HER2 receptor captured the clinically observed range well (~0–2.21 µg/ml).
Simulations from the shedding model predicted an inverse dependence of the trastuzumab trough concentration on the shed ECDHER2 serum levels, with a dramatic decrease in the simulated trough level of trastuzumab when plasma ECDHER2 concentration was in the range of 500–1,000 ng/ml (Figure 4b). This is of interest because, based on clinical data, a plasma level of 500 ng/ml of ECDHER2 was set as a cutoff value for the stratification of data analysis in a study showing that the shed ECDHER2 level in serum was significantly associated with clinical outcome.16 Simulations indicate that a number of factors appear to contribute to this steep decrease in trough trastuzumab concentrations when the plasma level of ECDHER2 reaches a concentration of 500 ng/ml. These include the relative potency of trastuzumab for the soluble and the membrane-bound receptor, the amount of membrane-bound receptor, the shedding rate, and the administered dose of trastuzumab. In simulations in which the trastuzumab affinity for the soluble target was reduced, the membrane-bound target occupancy was improved (Figure 5). Using the range of parameters described in this manuscript, there was a lower bound of affinity for the soluble target where a further reduction did not result in a higher occupancy of membrane-bound receptor. This is in contrast with the observation that a higher dose always resulted in a higher trough level and a higher occupancy of the membrane-bound receptor. These contrasting results are observed due to a depot effect exerted by the drug–target (soluble) complex, which acts as a reservoir for drug in plasma and the interstitial space. When free drug level falls, drug is released from the drug–target (soluble) complex, maintaining a higher trough level and receptor occupancy for longer periods. This depot effect was only observed when potency for the soluble target is high and the dose of trastuzumab is increased. It was not observed when the affinity for the soluble target is reduced and dosing level maintained at a constant level because the reduction in affinity limits the formation of the soluble drug–target complex forming the depot. This depot effect may also be of importance for protein therapeutics other than mAbs that generally have a shorter half-life. If elimination of the protein–target complex was slower than the elimination of the protein, this could lead to alterations in the PK of the protein and a longer residence of drug in the body. The general TMDD–shedding model described here could be used to explore this possibility further. How feasible is it in practice to engineer antibodies that maintain potency against membrane-bound targets while having a reduced affinity for the soluble receptor is an open question. However, it may be possible to exploit avidity effects for the membrane-bound receptor, giving tighter binding at the cell surface than to the soluble receptor in solution. One further approach that has been demonstrated to increase membrane-bound target occupancy is to shorten the dosing interval.24
Two mechanisms could result in increased levels of shed target in patients compared with those in healthy volunteer populations. These are the following: (i) the same level of membrane-bound target and an increased shedding rate in patients and (ii) increased levels of membrane-bound target in patients with the same shedding rate. A combination of these effects could be observed, with the contribution of the two mechanisms differing from target to target. As shown in the simulations presented here, the described shedding model can deal with both of these scenarios. The impact of slower binding kinetics (reduced rates of association and disassociation) at the membrane-bound target compared with that at the soluble target could also be simulated using the model. Using the full TMDD–shedding model with slower binding kinetics at the membrane-bound receptor than that at the soluble target resulted in reduced membrane-bound receptor occupancy and higher trough plasma concentrations (see Supplementary Figures S3 and S4, Simulations for slow binding kinetics of drugs and membrane-bound target).
The presence of soluble target in both plasma and the interstitial space represents a barrier to the drug reaching its pharmacological target on cell membranes in tissues. High levels of the shed target antigen in systemic circulation and in the interstitial space can reduce the effectiveness of the targeted therapy by competing for ligand and reducing the amount of ligand available to bind to pharmacological target. However, the soluble ligand complex can also form a depot of the drug that is later released to increase drug binding to the pharmacological target. The balance of these effects will depend on the relative rates of the elimination of soluble complex (kelm,s and kelm,p), the off rates for the drug–receptor (soluble) complex, and the relative concentration of the drug and soluble receptors. The interplay of these different factors is complex; therefore, we have used a modeling approach with parameter inputs largely derived from in vitro data to simulate the plasma concentrations of trastuzumab following different dosing regimens in individuals with different levels of ECDHER2 in plasma. Further work to assess the ability of the described model to simulate other case studies is warranted.
Methods
Minimal PBPK model for mAbs.
The structure of the minimal PBPK model is shown in Figure 1. It comprises three compartments: plasma, tissue, and lymph node, with the tissue compartment being subdivided into vascular, endothelial, and interstitial spaces. This structure is derived from the full PBPK model originally proposed by Garg and Balthasar.25 The model accounts for the following features of immunoglobulin G (IgG) disposition: (i) IgG enters tissue vascular space by arterial plasma flow (Q) and exits by venous plasma flow (Q−L); (ii) IgG distributes from the vascular space directly into the interstitial space by convective transport governed by lymph flow (L) and the vascular reflection coefficient (σv); (iii) IgG moves from the vascular and/or interstitial space into the endothelial space by fluid phase endocytosis (Kup); (iv) binding of intact IgG to FcRn (the neonatal Fc receptor) in the endothelial space is described by an equilibrium constant (at pH 6.0), KD; (v) unbound IgG within the endothelial space can be cleared from the system (CLcat); (vi) IgG bound to FcRn recycles either to the vascular (FR,Krc) or interstitial space (1 − FR,Krc); and (vii) IgG moves from the interstitial space to the lymph node by convective lymph flow (L) governed by the lymphatic reflection coefficient (σi).
Endogenous and exogenous IgG (i.e., the administered mAbs) are modeled simultaneously and compete for FcRn binding in the endothelial space. The equations describing the behavior of exogenous IgG in the minimal PBPK model are as follows:
 |
 |
 |
 |
 |
Here, CP, CI, CL, and CV are free IgG concentrations in plasma, interstitial space, lymph node, and tissue vascular space, respectively, CTE is the total IgG concentration in the endothelial space. Vx is the volume of compartment x, and other terms are as described in Figure 1. In(t) is the infusion rate and R0 is the mass flux produced by intravenous bolus or subcutaneous administration.
Analogous equations describe the behavior of endogenous IgG. The two sets of equations are coupled through the unbound fractions of endogenous and exogenous IgG in the endothelial compartment (see Supplementary Material for details).
TMDD model incorporating shedding.
Consider a membrane-bound pharmacological target (RM) that is subject to ECD shedding (Figure 1). The synthesis and degradation rates of RM are represented by ksyn,m and kdeg,m, respectively. Target shedding is characterized by a first-order rate constant ksh,p. The soluble form of the target in the interstitial space (RS) is subject to lymphatic transport and can also diffuse across the capillary to enter the circulation (RP; Figure 1). In the model, movement of RS from the interstitial space to the plasma is assumed to follow first-order kinetics and is described by a lumped rate constant (λ), which represents the transport of the soluble target in the interstitial space to the plasma through both capillary and lymphatic routes. For soluble targets with a large molecular size, transport through the lymphatic route will predominate such that λ represents this process only.
For completeness, the model allows for synthesis and degradation of soluble species in the interstitial space and plasma, in addition to shedding. After dosing, mAb binding to target occurs simultaneously in the plasma and the interstitial compartments. Within the interstitial space, the soluble target RS and membrane-bound target RM compete for the drug. Elimination of the drug–target (membrane-bound) complex is described by the internalization rate constant kint,m and elimination of the soluble targets in the interstitial space and plasma by the rate constants kelm,s and kelm,p, respectively.
The parameter ksh,p represents the shedding under normal physiological conditions or under pathophysiological conditions before drug administration. To include the drug effect on shedding, ksh,p can be replaced by the following:
 |
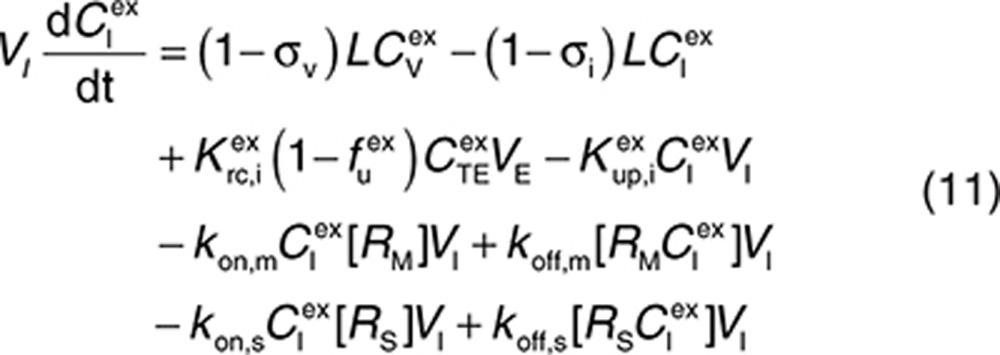
to represent a stimulatory or inhibitory effect on the shedding rate. A first-order rate constant ksh,d is used to describe formation of the drug–target (membrane-bound) complex due to drug-induced cell breakdown. It is also assumed that only a certain percentage (α) of the membrane-bound target eliminated by this mechanism adds to the soluble target population in the interstitial space. The following mass balance equations govern the dynamics of the drug and its targets along with Eqs. 2, 3, and 5.
 |
 |
 |
 |
 |
 |
 |
 |
Initial conditions can be derived by assuming that the system without drug is at equilibrium:
 |
 |
 |
Thus,
 |
 |
 |
Therefore, the initial conditions can be defined as
 |
 |
QSS TMDD.
Assuming that QSS conditions apply,13 i.e., the target binding and internalization (or elimination) processes rapidly reach steady state, Eqs. 8, 10, and 13 can be replaced with
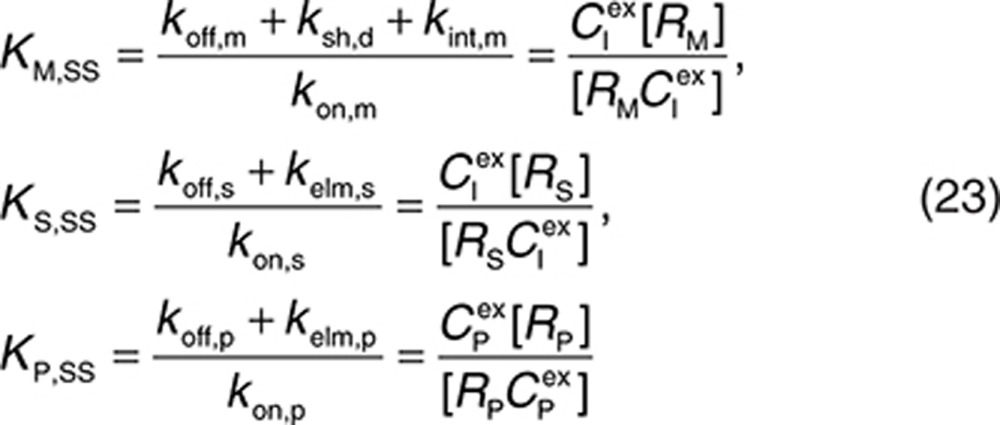 |
respectively. Based on these three equations and using the conservation of receptor species
 |
the following can be derived:
 |
By adding Eqs. 7 and 8, 9 and 10, 12 and 13, 13 and 14, and 8, 10, 11 together, respectively, and using conservation relations 22 for target and for drug given by the equation
the following equations governing total concentrations of drug and targets are derived:
 |
 |
 |
 |
 |
Here, the free drug concentrations  and
and  are given by the following expressions:
 |
 |
Therefore, at each time integration, steps 32 and 33 have to be evaluated to derive free concentrations such that the right-hand sides of Eqs. 2, 3, 5, and 27–31 can be calculated with a standard ordinary differential equation solver. The free drug concentration in plasma can be calculated from Eq. 33, and free drug in the interstitial space is obtained by solving the nonlinear Eq. 32. The Newton–Raphson iteration method is a suitably robust and efficient method for solving these types of equations (see Supplementary Material).
Simulation of trastuzumab kinetics.
The standard dosing schedule of trastuzumab (146 kDa) is a 4-mg/kg loading dose, followed by a 2-mg/kg weekly dose by intravenous infusion.18 The PK of trastuzumab were simulated accounting for binding to both membrane-bound HER2 (185 kDa) and the soluble ECD of HER2 (~97–115 kDa) in the interstitial space and plasma. Values for the model parameters were obtained from the literature (see below). Simulations were performed using Matlab (version R2012a; MathWorks, Natick, MA).
Parameter values.
The parameters used in the minimal PBPK model in the absence of TMDD were the same for endogenous IgG and trastuzumab (see Supplementary Table S1), with the exception that the KD for FcRn binding of trastuzumab (774 nmol/l) was taken from Suzuki et al.20 The half-life of trastuzumab in the absence of TMDD was estimated to be ~19 days. The HER2 target concentration level was estimated based on a tumor size of 2–5 cm in diameter (stage T2 of the tumor-node-metastasis classification system),26 assuming a spherical tumor with a cell density of 106 cells/µl and between 200,000 and 600,000 copies of HER2 per cell.27 The diluting effect of the large surrogate compartment of the interstitial space for the tumor is accounted for. The estimate of the average HER2 target level in the interstitial space was in the range of 0.000122–0.00574 µmol/l. Thus, [RM]ss was set at 0.0035 µmol/l in the simulations.
The parameters defining the binding of trastuzumab to HER2 are taken from in vitro studies21 (kon,m = 2,520 (µmol/l)−1 h−1, koff,m = 1.26 h−1, and KD = 0.5 nmol/l). Unless stated otherwise, binding to the soluble receptor (in both plasma and interstitial space) was described by the same values. The half-life of HER2 protein was 8 h,28 and trastuzumab has no significant effect on the internalization of HER2.22 Therefore, we set kdeg,m = kint,m = 0.1 h−1. The synthesis rate ksyn,m for HER2 was calculated using Eq. 18 once the shedding rate is defined.
It was assumed that soluble ECDHER2 in the interstitial space was formed only by shedding and, therefore, synthesis (ksyn,s) and degradation (kdeg,s) rates were set to 0. Because the molecular size of ECDHER2 is quite large, transport of this species across capillaries to the circulation was assumed to be negligible. Thus, λ (0.01 h−1) represents only lymphatic transport and can be determined by the lymph flow rate (~0.12 l/h in a 73-kg human) and the volume of the interstitial space (~12 l).29 The initial concentration of soluble targets can be determined by Eq. 19. Because the drug–target (soluble) complex is larger than the soluble target, its elimination from the interstitial space can also be assumed to be mediated solely by lymphatic transport (kelm,s = λ). This complex is not further tracked in this current model, although it may also be transported into the circulation through lymph transport, similar to the fate of the endogenous species of RS. Thus, an underlying assumption in the model, as parameterized in this case, is that the amount of the complex reaching the circulation via lymph is much lower than the amount of complex formed by drug binding in plasma. The soluble target in plasma is assumed to be produced only following translocation from the interstitial space. Therefore, its synthesis rate is set to zero. The degradation of ECDHER2 and the elimination rate of drug–HER2 complex are set to be equal and large, 0.2 h−1, which is equivalent to a plasma clearance of 0.62 l/h. Setting such a large clearance for the plasma complex is in line with the existing explanation on the clinical data that faster clearance of drug when high level of ECDHER2 present in plasma is due to fast removal of the complex in plasma.15 Finally, the initial concentration of ECDHER2 in plasma can be calculated by Eq. 20 once the shedding rate is defined. We assumed that the drug has no effect on the shedding process (ksh,d = 0). The upper boundary value for shedding rate, ksh,p of 0.4 h−1, was chosen based on in vitro measurement of the shedding rate.23 Considering that in vivo, the cells in a tumor are packed more densely than in an in vitro culture, thereby decreasing the access of cleavage enzymes to HER2,30 and that in vivo a substantial proportion of cells do not express high levels of HER2, it was assumed that the in vitro value would represent a maximum shedding rate. Varying the shedding rate ksh,p between 0 and 0.4 h−1 and calculating steady-state concentrations of the soluble HER2 receptor using Eq. 18 generates a range of initial concentrations of ECDHER2 in plasma that correspond to those observed clinically. The shedding rate of drug–receptor (membrane-bound) complex was assumed to be zero, as shown in vitro by Molina et al.23
Author Contributions
L.L. designed and performed the research. L.L., I.G., and R.R. analyzed the data. L.L., I.G., R.R., and M.J. wrote the manuscript.
Conflict of Interest
L.L., I.G., R.R., and M.J. are employees of Simcyp Limited (a Certara company).
Study Highlights
Acknowledgments
The authors thank Geoffrey T. Tucker for his thorough editing of the manuscript. The help of James Kay in preparing the manuscript is appreciated.
This work was funded by Simcyp Limited (UK) (a Certara Company). The Simcyp Simulator is freely available, following completion of the training workshop, to approved members of academic institutions and other nonprofit organizations for research and teaching purposes. Parts of this work have been published as posters at the American Conference on Pharmacometrics 2013 and the Population Approach Group in Europe 2013.
The structural model has been incorporated into Simcyp Simulator Version 13.2. The original Matlab model is available free of charge for scientific research by nonprofit organizations following appropriate agreement on IP rights of Simcyp Limited.
Supplementary Material
References
- Berlin C.M., Schimke R.T. Influence of turnover rates on the responses of enzymes to cortisone. Mol. Pharmacol. 1965;1:149–156. [PubMed] [Google Scholar]
- Schimke R.T. Control of enzyme levels in mammalian tissues. Adv. Enzymol. Relat. Areas Mol. Biol. 1973;37:135–187. doi: 10.1002/9780470122822.ch3. [DOI] [PubMed] [Google Scholar]
- Mager D.E., Jusko W.J. General pharmacokinetic model for drugs exhibiting target-mediated drug disposition. J. Pharmacokinet. Pharmacodyn. 2001;28:507–532. doi: 10.1023/a:1014414520282. [DOI] [PubMed] [Google Scholar]
- Arribas J., Borroto A. Protein ectodomain shedding. Chem. Rev. 2002;102:4627–4638. doi: 10.1021/cr010202t. [DOI] [PubMed] [Google Scholar]
- Kuang B., King L., Wang H.F. Therapeutic monoclonal antibody concentration monitoring: free or total. Bioanalysis. 2010;2:1125–1140. doi: 10.4155/bio.10.64. [DOI] [PubMed] [Google Scholar]
- Codony-Servat J., Albanell J., Lopez-Talavera J.C., Arribas J., Baselga J. Cleavage of the HER2 ectodomain is a pervanadate-activable process that is inhibited by the tissue inhibitor of metalloproteases-1 in breast cancer cells. Cancer Res. 1999;59:1196–1201. [PubMed] [Google Scholar]
- Lennon S., et al. Utility of serum HER2 extracellular domain assessment in clinical decision making: pooled analysis of four trials of trastuzumab in metastatic breast cancer. J. Clin. Oncol. 2009;27:1685–1693. doi: 10.1200/JCO.2008.16.8351. [DOI] [PubMed] [Google Scholar]
- Moreno-Aspitia A., et al. Soluble human epidermal growth factor receptor 2 (HER2) levels in patients with HER2-positive breast cancer receiving chemotherapy with or without trastuzumab: results from North Central Cancer Treatment Group adjuvant trial N9831. Cancer. 2013;119:2675–2682. doi: 10.1002/cncr.28130. [DOI] [PMC free article] [PubMed] [Google Scholar]
- Manshouri T., et al. Circulating CD20 is detectable in the plasma of patients with chronic lymphocytic leukemia and is of prognostic significance. Blood. 2003;101:2507–2513. doi: 10.1182/blood-2002-06-1639. [DOI] [PubMed] [Google Scholar]
- Giles F.J., et al. Circulating CD20 and CD52 in patients with non-Hodgkin's lymphoma or Hodgkin's disease. Br. J. Haematol. 2003;123:850–857. doi: 10.1046/j.1365-2141.2003.04683.x. [DOI] [PubMed] [Google Scholar]
- Tokuda Y., et al. Dose escalation and pharmacokinetic study of a humanized anti-HER2 monoclonal antibody in patients with HER2/neu-overexpressing metastatic breast cancer. Br. J. Cancer. 1999;81:1419–1425. doi: 10.1038/sj.bjc.6690343. [DOI] [PMC free article] [PubMed] [Google Scholar]
- Zhang Y., Pastan I. High shed antigen levels within tumors: an additional barrier to immunoconjugate therapy. Clin. Cancer Res. 2008;14:7981–7986. doi: 10.1158/1078-0432.CCR-08-0324. [DOI] [PMC free article] [PubMed] [Google Scholar]
- Gibiansky L., Gibiansky E., Kakkar T., Ma P. Approximations of the target-mediated drug disposition model and identifiability of model parameters. J. Pharmacokinet. Pharmacodyn. 2008;35:573–591. doi: 10.1007/s10928-008-9102-8. [DOI] [PubMed] [Google Scholar]
- Carney W.P., Neumann R., Lipton A., Leitzel K., Ali S., Price C.P. Potential clinical utility of serum HER-2/neu oncoprotein concentrations in patients with breast cancer. Clin. Chem. 2003;49:1579–1598. doi: 10.1373/49.10.1579. [DOI] [PubMed] [Google Scholar]
- Baselga J., et al. Phase II study of weekly intravenous recombinant humanized anti-p185HER2 monoclonal antibody in patients with HER2/neu-overexpressing metastatic breast cancer. J. Clin. Oncol. 1996;14:737–744. doi: 10.1200/JCO.1996.14.3.737. [DOI] [PubMed] [Google Scholar]
- Pegram M.D., et al. Phase II study of receptor-enhanced chemosensitivity using recombinant humanized anti-p185HER2/neu monoclonal antibody plus cisplatin in patients with HER2/neu-overexpressing metastatic breast cancer refractory to chemotherapy treatment. J. Clin. Oncol. 1998;16:2659–2671. doi: 10.1200/JCO.1998.16.8.2659. [DOI] [PubMed] [Google Scholar]
- Carter P., et al. Humanization of an anti-p185HER2 antibody for human cancer therapy. Proc. Natl. Acad. Sci. U.S.A. 1992;89:4285–4289. doi: 10.1073/pnas.89.10.4285. [DOI] [PMC free article] [PubMed] [Google Scholar]
- Bruno R., Washington C.B., Lu J.F., Lieberman G., Banken L., Klein P. Population pharmacokinetics of trastuzumab in patients with HER2+ metastatic breast cancer. Cancer Chemother. Pharmacol. 2005;56:361–369. doi: 10.1007/s00280-005-1026-z. [DOI] [PubMed] [Google Scholar]
- Baselga J. Phase I and II clinical trials of trastuzumab. Ann. Oncol. 2001;12 suppl. 1:S49–S55. doi: 10.1093/annonc/12.suppl_1.s49. [DOI] [PubMed] [Google Scholar]
- Suzuki T., et al. Importance of neonatal FcR in regulating the serum half-life of therapeutic proteins containing the Fc domain of human IgG1: a comparative study of the affinity of monoclonal antibodies and Fc-fusion proteins to human neonatal FcR. J. Immunol. 2010;184:1968–1976. doi: 10.4049/jimmunol.0903296. [DOI] [PubMed] [Google Scholar]
- Bostrom J., Haber L., Koenig P., Kelley R.F., Fuh G. High affinity antigen recognition of the dual specific variants of herceptin is entropy-driven in spite of structural plasticity. PLoS ONE. 2011;6:e17887. doi: 10.1371/journal.pone.0017887. [DOI] [PMC free article] [PubMed] [Google Scholar]
- Austin C.D., et al. Endocytosis and sorting of ErbB2 and the site of action of cancer therapeutics trastuzumab and geldanamycin. Mol. Biol. Cell. 2004;15:5268–5282. doi: 10.1091/mbc.E04-07-0591. [DOI] [PMC free article] [PubMed] [Google Scholar]
- Molina M.A., Codony-Servat J., Albanell J., Rojo F., Arribas J., Baselga J. Trastuzumab (herceptin), a humanized anti-Her2 receptor monoclonal antibody, inhibits basal and activated Her2 ectodomain cleavage in breast cancer cells. Cancer Res. 2001;61:4744–4749. [PubMed] [Google Scholar]
- Li L., Gardner I., Rachel R., Jamei M. Poster presentation at American Conference on Pharmacometrics; Fort Lauderdale, FL; May 2013. Incorporating target shedding into a minimal PBPK-TMDD model for mAbs. pp. 12–15. [Google Scholar]
- Garg A., Balthasar J.P. Physiologically-based pharmacokinetic (PBPK) model to predict IgG tissue kinetics in wild-type and FcRn-knockout mice. J. Pharmacokinet. Pharmacodyn. 2007;34:687–709. doi: 10.1007/s10928-007-9065-1. [DOI] [PubMed] [Google Scholar]
- Singletary S.E., Connolly J.L. Breast cancer staging: working with the sixth edition of the AJCC Cancer Staging Manual. CA. Cancer J. Clin. 2006;56:37–47; quiz 50. doi: 10.3322/canjclin.56.1.37. [DOI] [PubMed] [Google Scholar]
- Ho-Pun-Cheung A., et al. Quantification of HER expression and dimerization in patients' tumor samples using time-resolved Förster resonance energy transfer. PLoS ONE. 2012;7:e37065. doi: 10.1371/journal.pone.0037065. [DOI] [PMC free article] [PubMed] [Google Scholar]
- Harwerth I.M., Wels W., Marte B.M., Hynes N.E. Monoclonal antibodies against the extracellular domain of the erbB-2 receptor function as partial ligand agonists. J. Biol. Chem. 1992;267:15160–15167. [PubMed] [Google Scholar]
- Guyton A.C., Hall J.E.Textbook of Medical Physiology11th edn. (Elsevier; Philadelphia, PA; 2005 [Google Scholar]
- Pak Y., Zhang Y., Pastan I., Lee B. Antigen shedding may improve efficiencies for delivery of antibody-based anticancer agents in solid tumors. Cancer Res. 2012;72:3143–3152. doi: 10.1158/0008-5472.CAN-11-3925. [DOI] [PMC free article] [PubMed] [Google Scholar]
Associated Data
This section collects any data citations, data availability statements, or supplementary materials included in this article.


