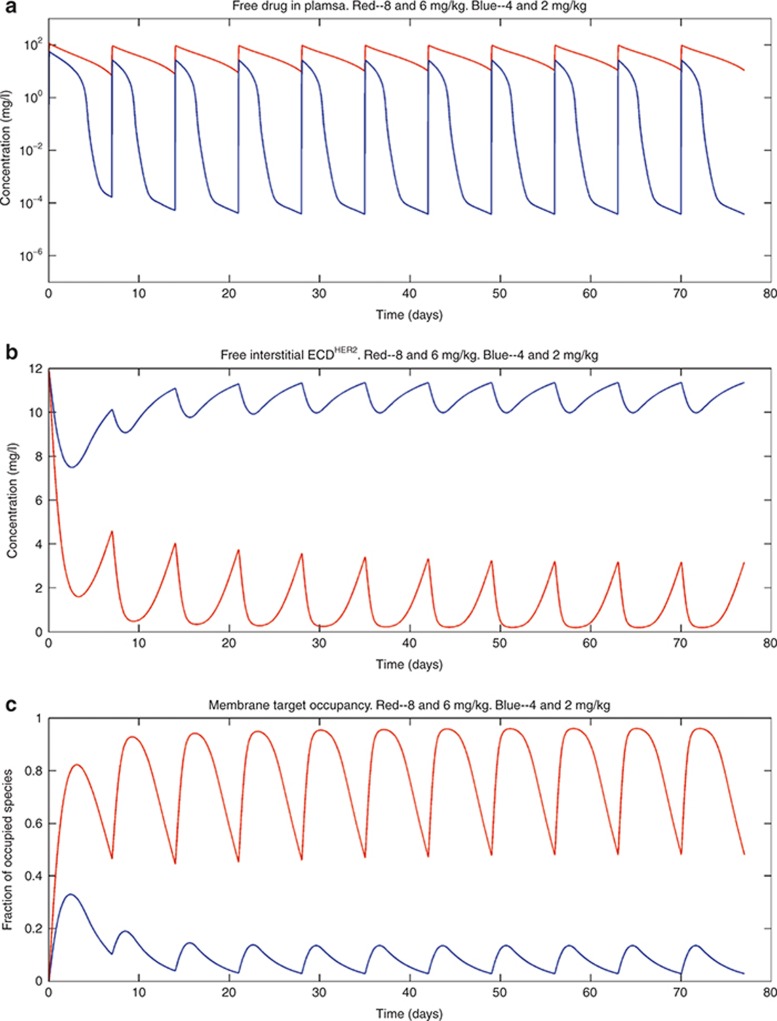
Figure 6.
Simulations were performed with two different dosing regimes. Panel (a) shows the simulated outputs in plasma, panel (b) shows the free soluble receptor in the interstitial space, and panel (c) shows the receptor occupancy at the membrane-bound target. The blue curves represent results from a dosing regimen of 4-mg/kg loading dose and then 2-mg/kg dose weekly by an intravenous (i.v.) infusion of 90 min for each dose; the red curves are the results from a dosing regimen of 8-mg/kg loading dose and then 6-mg/kg dose weekly, with i.v. infusion of 90 min for each dose. In these simulations, the shedding rate (ksh,p) was 0.34 h−1 and the initial plasma concentration of ECDHER2 = 2,162 ng/ml, which is close to the maximum observed level of ECDHER2 (2.21 µg/ml) in the clinic. ECD, ectodomain.

