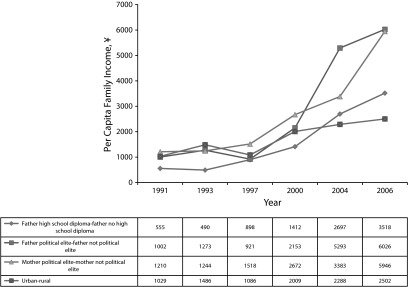
FIGURE 3—

Mean difference in per capita family income for children and adolescents aged 2 to 18 years between higher and lower socioeconomic groups: China Health and Nutrition Survey, 1991–2006.
Note. Family income adjusted according to the Consumer Price Index.
