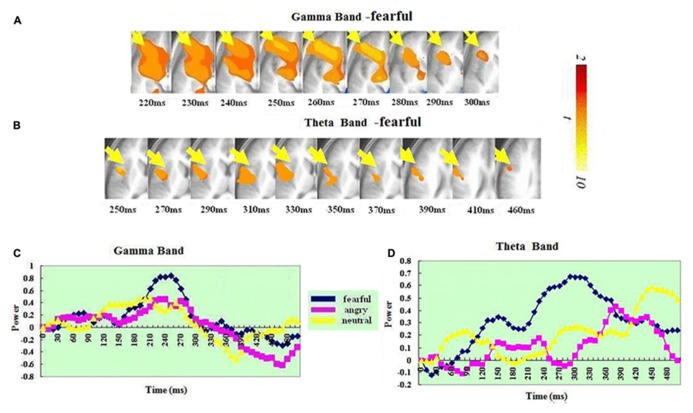
FIGURE 3.
Spatiotemporal profiles for IFG-insula in the in the gamma and theta bands. The brain map series (A,B) indicate the ERS development in specific brain areas with the left hemisphere is on the right and the right hemisphere is on the left. The curves (C,D) represent temporal profiles obtained from a peak voxel in a specified area in the three conditions respectively. The time courses are obtained from the normalized power value in each window. The blue curve refers to responses to fearful, the purple to angry and the yellow to neutral expressions. The X-axis represents the development of time (ms) with an increment of 10 ms for each time segment. The Y-axis represents the normalized signal power. The brain maps and curves for the gamma band are taken from Luo et al. (2007) with minor adaptations.

