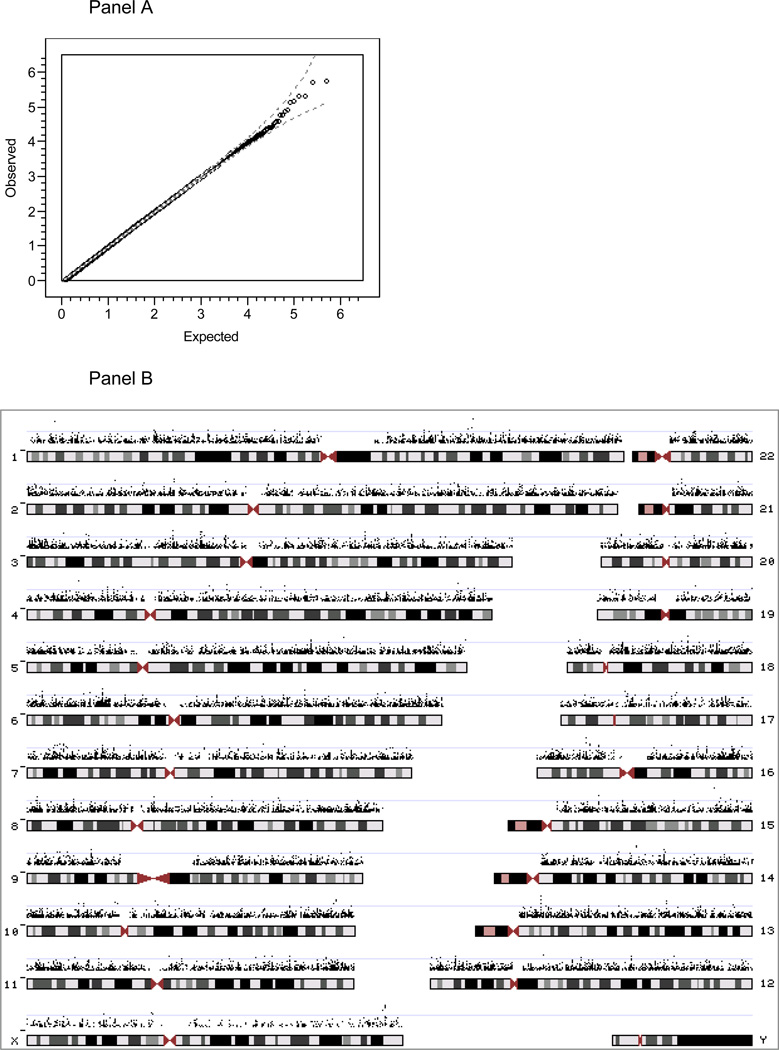
Figure 1.
Results of single-marker association tests of case-control status for 492,900 SNPs. Panel A. shows the QQ plot (77) of the observed p-values, −log10 (p), versus those expected by chance, , where p is the asymptotic p-value from the additive test that the SNP coefficient is zero, i is the rank for each SNP p-value (1=smallest, L=largest), and L is the number of SNPs. The dashed lines show the expected 95% probability interval for ordered p-values. Panel B depicts −log10 (p) for the 26,738 SNPs with p-values < 0.05 in the context of the human genome in order to make spatial clustering more evident.

