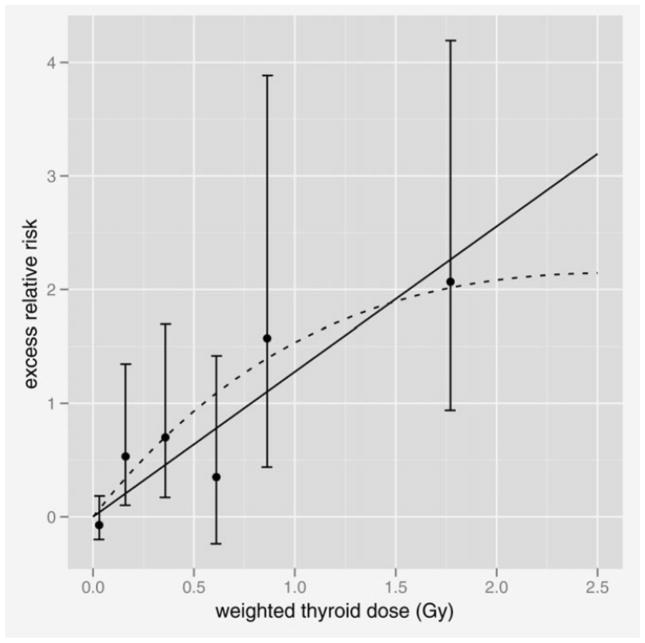
Figure 1.
Fitted dose–response functions for thyroid cancer incidence in the LSS cohort. The solid line is the fitted linear ERR dose response, and the dashed curve is the fitted ERR based on linear-exponential dose–response model. The points are non-parametric estimates of the ERR in dose categories with 95% CIs. The line and points are all gender-averaged estimates at age 60 after exposure at age 10.

