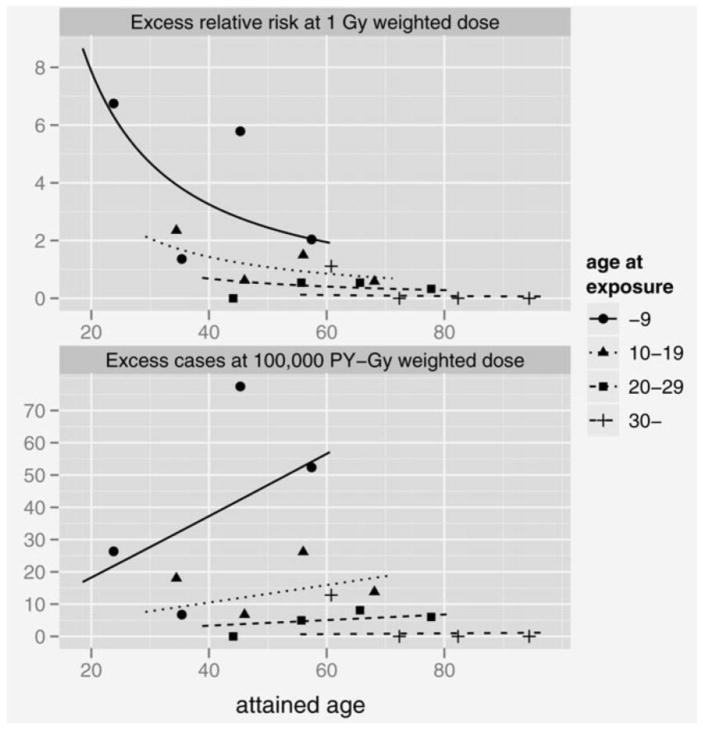
Figure 2.
Fitted temporal patterns and age-at-exposure variation in the radiation-associated risk for thyroid cancer in the LSS cohort. The upper panel presents the ERR at 1 Gy and the lower panel the fitted EAR at 100,000 person-years-Gy, with attained age for ages at exposure of 5 (“0–9” for categorical estimates), 15 (“10–19”), 25 (“20–29”) and 41 (“30–”) years. All curves and points are gender-averaged estimates.

