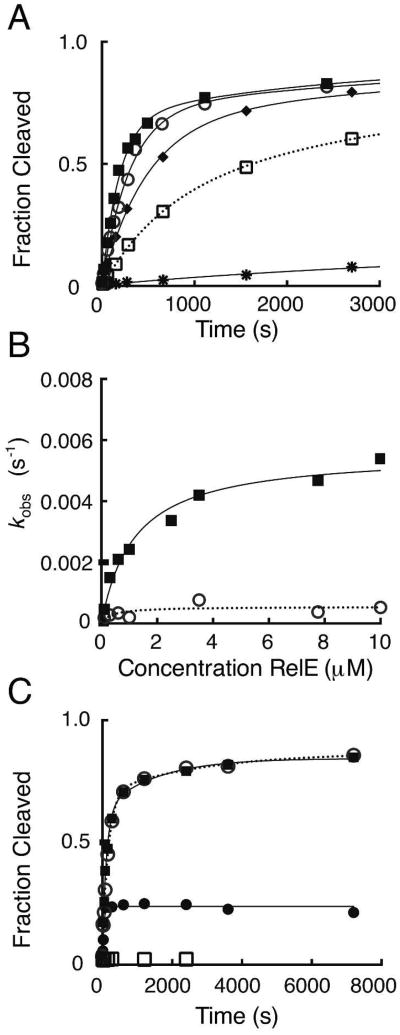
Figure 3. Analysis of single-turnover reaction kinetics of mutant RelE proteins.
(A) Measurement of single-turnover rates for R81A RelE. Reactions contain 20 nM RC and increasing concentrations of R81A RelE enzyme: 0.1 μM (*), 0.3 μM (□), 0.6 μM (◆), 2.5 μM (○), or 10 μM (■). The first 3,000 seconds of the time course are shown and full time courses were fit as done for wild-type. (B) Dependence of cleavage rates on R81A RelE enzyme concentration. The rates, kobs (s-1), for the fast (■) and slow phases (○) for a single replicate are plotted as a function of RelE concentration (μM). The rate constants (k2) and dissociation constants (Kd) extracted from hyperbolic fits of each replicate and the mean and SEM for each constant is listed in Table 1 and Table S1. (C) Antitoxin RelB pulse-chase quench experiments with R81A RelE. Reactions contain 20 nM RC and 10 μM R81A RelE and were quenched either chemically (○), enzymatically with 6-fold excess RelB (■), or the RC was pre-mixed with RelB prior to addition of RelE (□). Product formation for the pulse-chase reaction with antitoxin RelB is plotted for the total time (reaction time, t1, + quench delay time or chase, t2) where RelB was added after t1 = 78 seconds (•).

