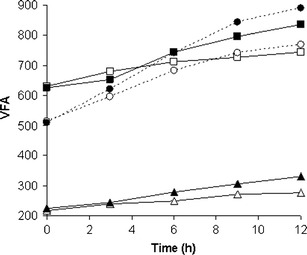
Fig. 1.

Changes in the concentration of VFA (in millimole per liter) during the incubation of ciliates the E. maggii (filled circle, empty circle), E. caudatum (filled square, empty square) and D. affine (filled triangle, empty triangle) with (black marks) and without (white marks) murein saccharides, respectively. Mean values (n = 3)
