Figure 4.

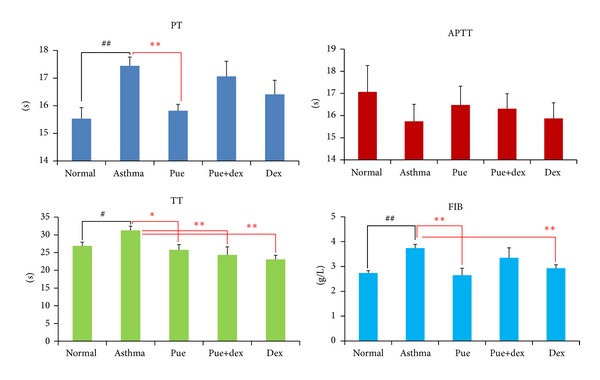
Effects of puerarin on PT, APTT, TT, and FIB. Values are expressed as means ± SEMs (n = 10/group). # P < 0.05 and ## P < 0.01 when compared with normal control group; *P < 0.05 and **P < 0.01 when compared with asthma group.

Effects of puerarin on PT, APTT, TT, and FIB. Values are expressed as means ± SEMs (n = 10/group). # P < 0.05 and ## P < 0.01 when compared with normal control group; *P < 0.05 and **P < 0.01 when compared with asthma group.