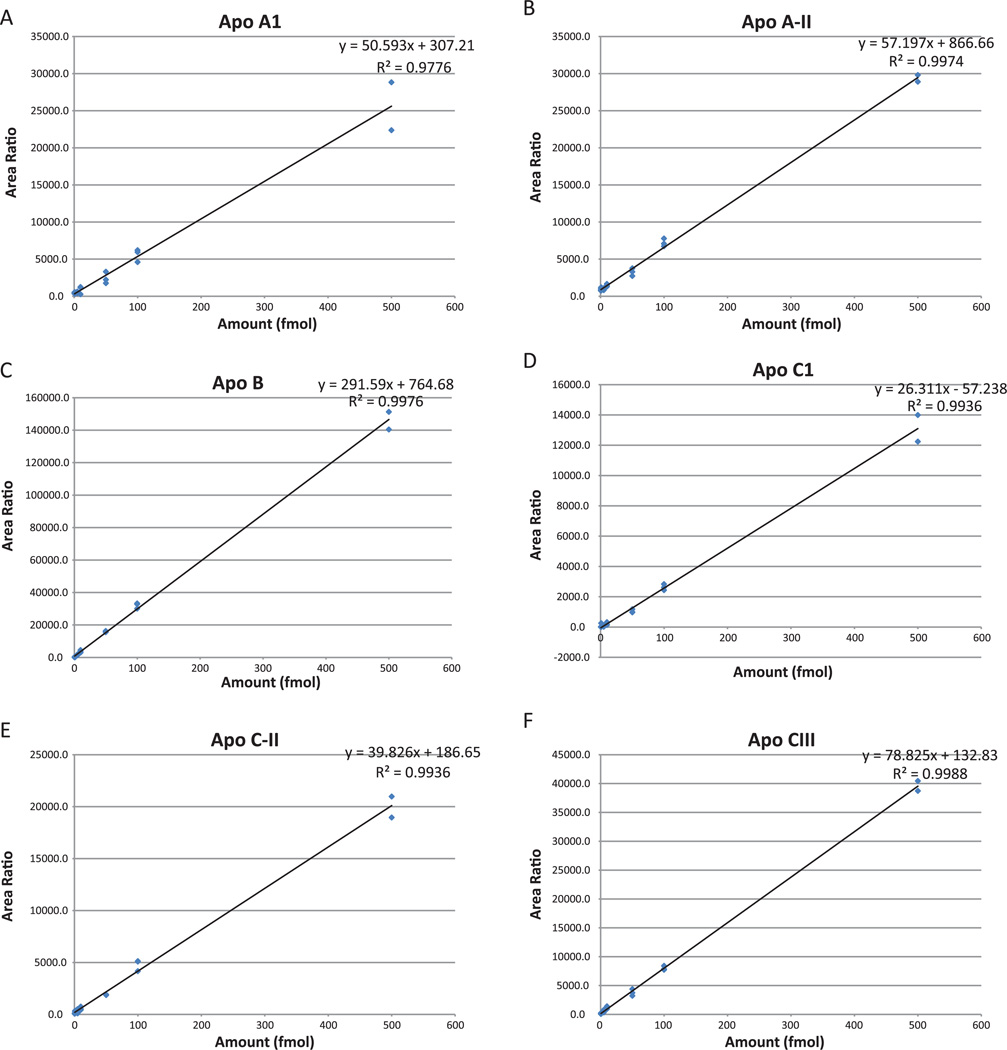
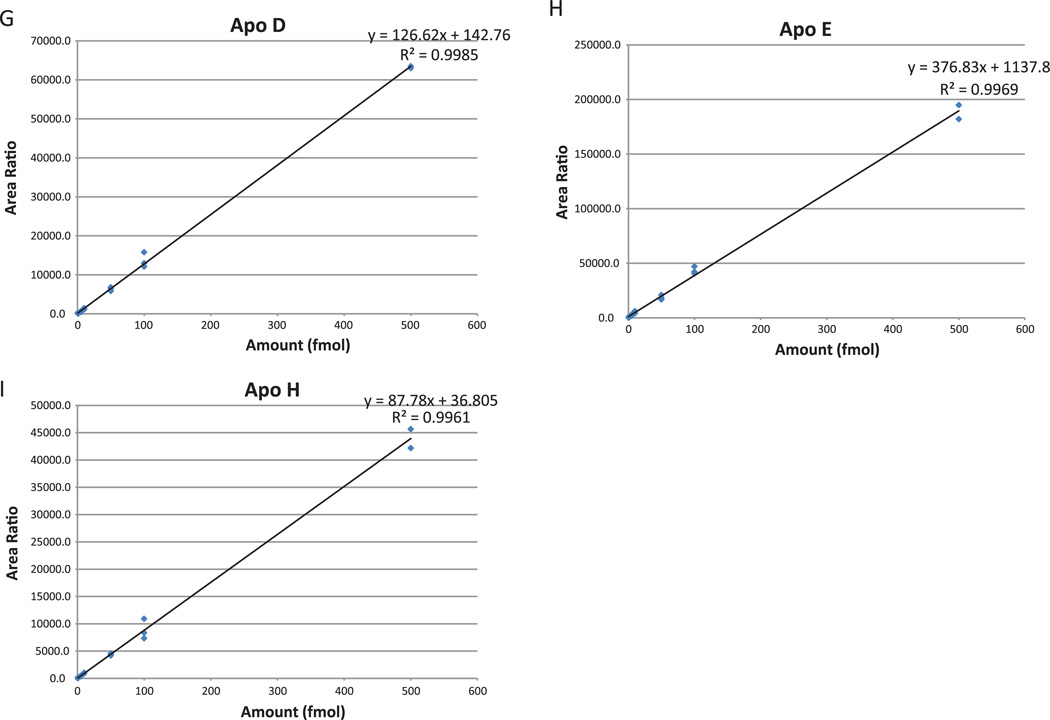
Figure 2.
Pinpoint-generated calibration curves for apolipoprotein heavy peptides in a background of 30 µg raw serum digest. The 8-point curves measured concentrations from 250 attomoles to 500 femtomoles on column, in triplicate. LLODs were estimated at 250–500 attomoles and LOQs were calculated between 1 and 5 femtomoles for each peptide. The linear correlation coefficients ranged from 0.93 to 0.99 and the CVs for points above the LOQ ranged from 0 to 20%. (A) apoA-I; (B) apoA-II; (C) apoB; (D) apoC-I; (E) apoC-II; (F) apoC-III; (G) apoD; (H) apoE; (I) apoH.


