
Figure 3.
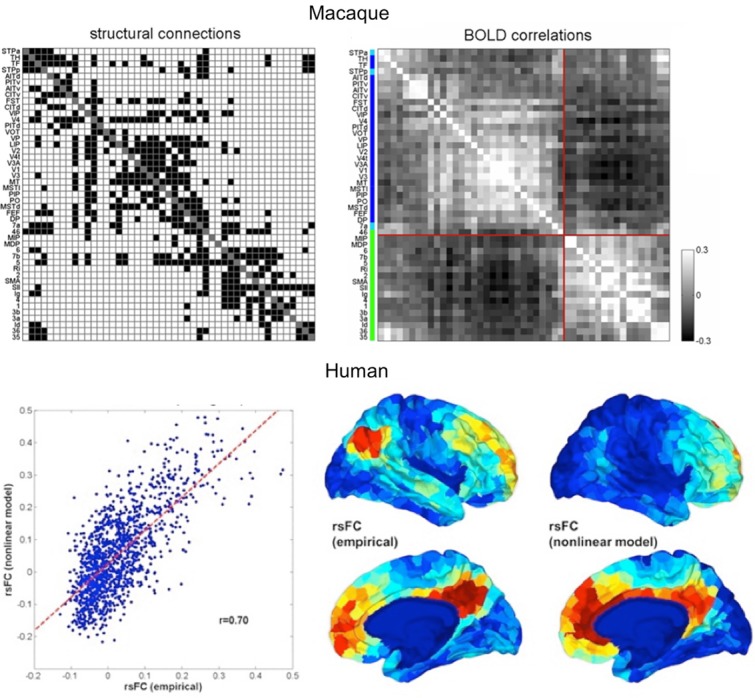
Bottom-up simulations of resting-state activity in macaques and humans. Top panel shows the anatomical network from CoCoMac, represented as a binary matrix of connections on the left, and the predicted fMRI functional connectivity on the right. The structure of the network induces the emergence of two anticorrelated subnetworks (modified from Ref. 64). Bottom panel shows the results of a similar modeling approach to human resting-state data. Structural connections were estimated using diffusion MRI tractography, and simulated fMRI functional connectivity was compared to empirical connectivity from a resting-state scan. The left-hand side shows the correlation between simulated and empirical whole-brain functional connectivity. The right-hand side shows a qualitative comparison between simulated and empirical functional connectivities of the posterior cingulate cortex. Modified from Ref. 58.